Following Vancouver Market trends, North Shore’s Real Estate Market also experienced significant growth in new listings in March among all home categories. This contributed to more opportunity for buyers looking for a home this spring.
Let’s analyse the latest statistics concerning North Shore offering insights into price movements, listing, and sales activities in North Vancouver and West Vancouver.
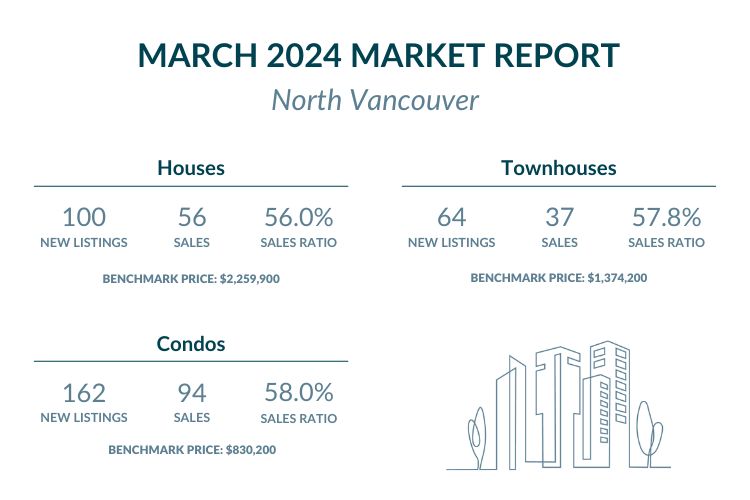
North Vancouver – Steady increase in sales ratio and prices
Price Analysis:
House/Detached:
North Vancouver saw a notable increase in house prices, with the benchmark price reaching $2,259,900, marking a 2.0% increase from February 2024. Year-over-year, there was a solid 5.4% increase, reflecting sustained demand in the housing segment.
Find North Vancouver houses under $2,260,000 here or priced over $2,260,000 here.
Townhouse/Attached:
Similarly, townhouses experienced a price surge, rising by 2.4% from the previous month to reach a benchmark price of $1,374,200. However, the year-over-year increase was more modest at 1.4%.
You can browse North Vancouver townhomes under $1,375,000 here, and priced over $1,375,000 here.
Condo/Apartments:
Condos also witnessed a significant price appreciation of 2.6% from February 2024, with a benchmark price of $830,200. Year-over-year, there was a substantial 7.8% increase, showcasing robust growth in the condo market.
Check out condos for under $830,000 in North Vancouver here or over $830,000 here.
New Listings and Sales:
Looking back over the past year, North Vancouver properties have seen varied growth rates. While there was a decrease in new listings for houses and condos compared to the same period last year, townhouses saw a slight increase year-over-year, indicating some activity in the market. New listings for single family homes in North Vancouver saw a slight increase from February 2024 to March 2024, with a year-over-year decrease of 33%. Despite a decrease in new house listings, townhouse listings remained relatively stable compared to the previous month, with a year-over-year increase of 17.2%. Condo listings experienced a modest decrease in March 2024 compared to February 2024, with a year-over-year decrease of 6.2%.
Sales ratios for March 2024 show healthy figures across all property types, with significant relative changes compared to the same month last year. Sales for houses rebounded in March 2024, with a sales ratio of 56.0%, representing a significant relative change of 16.4% compared to March 2023. Townhouse sales also showed resilience, with a sales ratio of 57.8% in March 2024, despite a relative change of -19.4% compared to March 2023. Condo sales remained robust, with a sales ratio of 58.0%, though showing a relative decrease of 10.1% compared to March 2023.
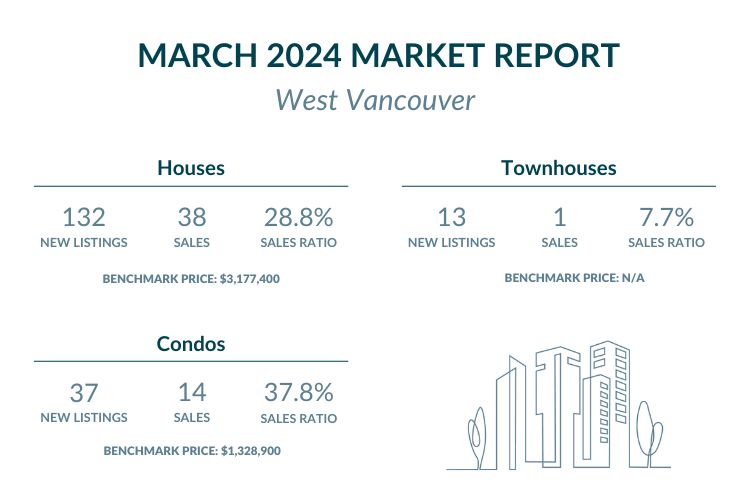
West Vancouver – Decrease in sales ratio and increase on prices
Price Analysis:
House/Detached:
West Vancouver experienced a significant price surge in houses, with a 3.3% increase from February 2024, reaching a benchmark price of $3,177,400. Year-over-year, there was a respectable 4.4% increase, indicating stability and growth in the segment.
You can look for West Vancouver houses under $3,180,000 here, and priced over $3,180,000 here.
Condo/Apartments:
However, condos in West Vancouver saw a slight decrease in prices, with a 0.8% decline from the previous month, reaching a benchmark price of $1,328,900. Year-over-year, there was still a notable 9.5% increase.
You can find West Vancouver condos under $1,330,000 here or priced over $1,330,000 here.
New Listings and Sales:
March 2024 saw an increase in new listings for houses compared to the same period last year, indicating some market activity. However, townhouses and condos experienced decreases in new listings year-over-year. New listings for houses in West Vancouver surged in March 2024, with a year-over-year increase of 26.5%. Despite a decrease in new townhouse listings, the year-over-year change remained relatively stable, with a decrease of 7.7%. Condo listings in West Vancouver experienced a notable decrease compared to March 2023, with a year-over-year decrease of 24.3%.
Sales activity for houses in West Vancouver remained relatively stable, with a sales ratio of 28.8% in March 2024, despite a significant relative change of -26.5% compared to March 2023. Townhouse sales decreased significantly, with a sales ratio of 7.7% in March 2024, showing a relative change of -73.1% compared to March 2023. Condo sales also experienced a decline, with a sales ratio of 37.8% in March 2024, representing a relative change of -20.9% compared to March 2023.
Conclusion
March 2024 showcased a dynamic real estate market on the North Shore, with varying trends in prices, new listings, and sales. While both North Vancouver and West Vancouver experienced price appreciation in houses, there were fluctuations in other segments such as condos and townhouses. As we progress further into the year, it will be intriguing to monitor how these trends evolve and shape the real estate landscape on the North Shore.
Featured Buildings


