The housing market in Metro Vancouver has begun 2024 on a robust note, with strong home sales. While the market concluded 2023 in a balanced state, January witnessed a shift favouring sellers, as the rate of newly listed properties failed to match the surge in home sales.
Projections for the 2024 market anticipate a modest increase in prices, ranging between two to three percent by year-end, largely driven by persistent demand confronting limited inventory. However, if the trends observed in January persist into the spring, the forecast for 2024 may prove to be overly conservative. Market dynamics can evolve swiftly, underscoring the importance of monitoring February’s data to discern whether the early signs of strength are enduring or merely a temporary blip.
Let’s analyse the latest statistics concerning North Vancouver, Vancouver East, Vancouver West, and West Vancouver, offering insights into price movements, listing, and sales activities.
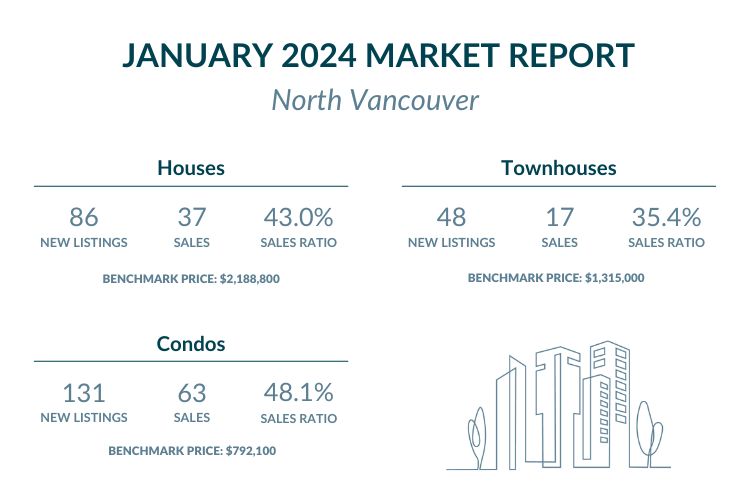
North Vancouver
Price Analysis:
House/Detached:
The benchmark price for a house in North Vancouver stood at $2,188,800. Notably, there was a slight decrease of -1.4% compared to December 2023. However, on a yearly basis, there was a 7.4% increase.
Find North Vancouver houses under $2,200,000 here or priced over $2,200,000 here.
Townhouse/Attached:
The benchmark price for a townhouse was $1,315,000, experiencing a marginal decline of 1.3% from the previous month. Year-over-year, there was a 1.0% increase.
You can browse North Vancouver townhomes under $1,300,000 here, and priced over $1,300,000 here.
Condo/Apartments:
With a benchmark price of $792,100, condos witnessed a minimal decrease of 0.8% compared to December 2023. However, over the span of a year, there was a 5.5% increase.
Check out condos for under $800,000 in North Vancouver here or over $800,000 here.
New Listings and Sales:
Across all property types, there was a notable increase in new listings compared to January 2023. Single family homes in North Vancouver saw a significant surge of 33.7%, townhouses increased by 14.6%, and condos remained stable with no year-over-year change.
The sales ratio for houses, townhouses, and condos stood at 43.0%, 35.4%, and 48.1%, respectively for January 2024. The relative changes of sales ratios to January 2023’s saw a similar rise for detached properties and apartments with 36.2% and 37.0% meanwhile attached properties experienced a decline of -19.3%.
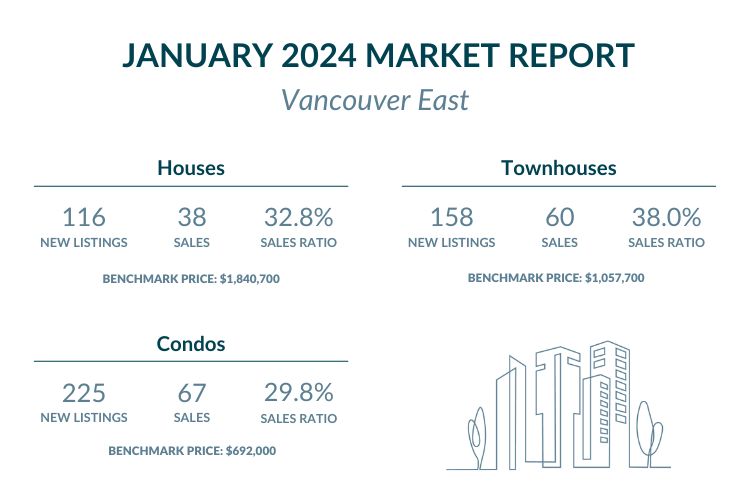
Vancouver East
Price Analysis:
House/Detached:
The benchmark price for a house in Vancouver East was $1,840,700, reflecting a slight decrease of 0.9% from December 2023. Year-over-year, there was a notable increase of 10.3%.
You can browse Vancouver East single family homes under $1,800,000 here, and priced over $1,800,000 here.
Townhouse/Attached:
With a benchmark price of $1,057,700, townhouses experienced a 1.4% decrease from the previous month. However, on an annual basis, there was a 3.8% increase.
Take a look at townhouses for under $1,060,000 in Vancouver East here or over $1,060,000 here.
Condo/Apartments:
Condos witnessed a minor decrease of 0.2% from December 2023, with a benchmark price of $692,000. Over the course of a year, there was a 3.0% increase.
You can find Vancouver East condos under $700,000 here or priced over $700,000 here.
New Listings and Sales:
The Vancouver East market saw an increase in new listings across all property types compared to January 2023. Notably, townhouses experienced a substantial surge of 47.5%. Detached homes saw the lowest increase with 9.5% and Condos new listings witnessed a considerable growth of 24.4%.
While sales ratios varied across property types, sales ratio houses, townhouses, and condos stood at 38.0%, 29.8%, and 26.7%. There was a general increase in activity compared to the same month last year, with townhouses showing the highest relative change of sales ratio with 12.6% and detached homes with a slight increase of 4.2%. On the other hand, the apartment’s relative sales ratio change decreased by -9.6%.

Vancouver West
Price Analysis:
House/Detached:
Vancouver West saw a decrease in house prices, with a benchmark price of $3,301,000, reflecting a 4.7% decline from December 2023. However, there was a 5.1% increase year-over-year.
Discover Vancouver West homes under $3,300,000 here or priced over $3,300,000 here.
Townhouse/Attached:
Townhouses experienced a 1.5% increase in prices from the previous month, with a benchmark price of $1,446,500. Year-over-year, there was a substantial 9.0% increase.
You can browse Vancouver West townhomes under $1,500,000 here, and priced over $1,500,000 here.
Condo/Apartments:
Condos witnessed a 1.7% increase in prices from December 2023, with a benchmark price of $830,100. Over the course of a year, there was a 3.5% increase.
Take a look at condos for under $840,000 in Vancouver West here or over $840,000 here.
New Listings and Sales:
Vancouver West saw an increase in new listings across all property types compared to January 2023, with condos experiencing the highest year-over-year percentage change of 17.3%. House and Townhouse new listings went up by 13.7% and 12.7%, respectively.
Townhouse sales ratio for January 2024 was the lowest with 18.6%, while the highest sales ratio was 31.0% for Condo. Detached house’s sales ratio stood at 26.7%. Sales ratios for houses and condos increased relative to the same month last year, with the last one only by 3.9% against a notability increase of 34.6% by attached properties. Meanwhile, townhouses experienced a decrease of -17.1% for relative change in sales ratio.
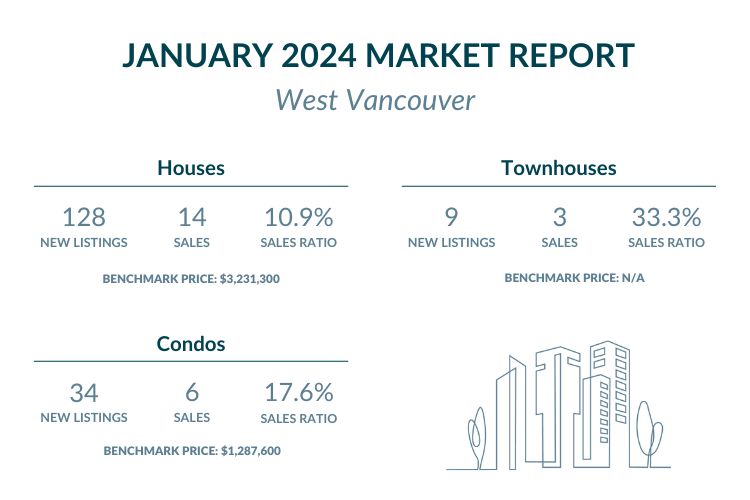
West Vancouver
Price Analysis:
House/Detached:
West Vancouver witnessed a 2.9% increase in house prices from December 2023, with a benchmark price of $3,231,300. Year-over-year, there was a 6.0% increase.
You can look for West Vancouver houses under $3,300,000 here, and priced over $3,300,000 here.
Condo/Apartments:
Condos also saw a slight increase of 1.3% in prices compared to the previous month, with a benchmark price of $1,287,600. Year-over-year, there was a 7.0% increase.
You can find West Vancouver condos under $1,300,000 here or priced over $1,300,000 here.
New Listings and Sales:
West Vancouver experienced an increase in new listings across houses and condos compared to January 2023, with houses showing the highest year-over-year percentage change of 32.8%, while apartments’ new listings went up similarly by 29.4%. Townhouse new listings, on the contrary, decrease by -22.2%.
The sales ratio for houses, townhouses, and condos stood at 10.9%, 33.3%, and 17.6%, respectively for January 2024. While the relative change in sales ratio for houses and condos decreased significantly compared to the same month last year, with -41.2% for detached and -52.9% for apartments, townhouses experienced a notable increase of 226.7%.
Conclusion
The first month of 2024 showcases a nuanced real estate landscape across Vancouver’s neighbourhoods. While some areas experienced price declines, others saw notable increases, from December 2023, reflecting the diverse dynamics within the market. Additionally, the surge in listings across most segments underscores shifting inventory levels, while sales performances vary, indicating differing levels of demand and market sentiment. As the year progresses, monitoring these trends will be crucial for both buyers and sellers navigating Vancouver’s dynamic real estate market.
Featured Buildings


