Vancouver Real Estate September 2026 | East & West Market
Written by Lynn Le Drew on October 8th, 2026
Vancouver real estate softened through September 2026 as the autumn listing season arrived. Moreover, condo sales fell sharply in both Vancouver East and Vancouver West. Meanwhile, house sales diverged, rising in Vancouver East and easing in Vancouver West. Consequently, every segment slipped into buyer’s market territory on the sales-to-new-listings measure.
Vancouver East Real Estate — September 2026
Vancouver East delivered mixed results in September 2026, with house sales climbing year-over-year. However, condo sales fell nearly 40% while benchmark prices extended their annual slide.
Price Analysis — Vancouver East
Vancouver East Houses:
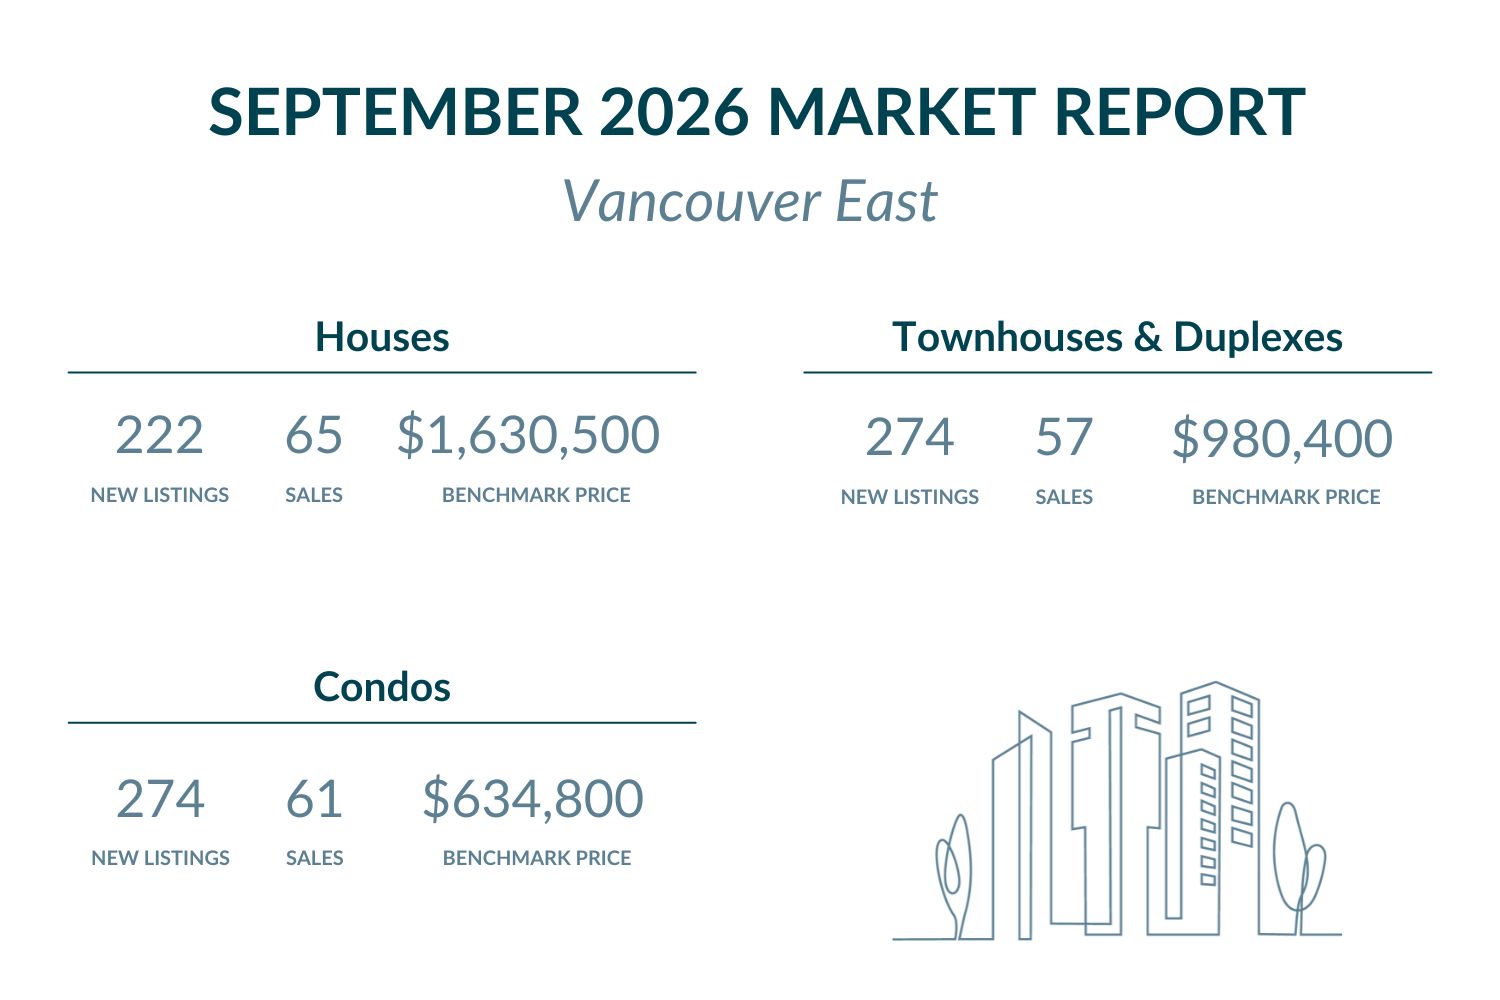
The benchmark price for houses in Vancouver East reached $1,630,500 in September 2026. Month-over-month, the benchmark edged up 0.6% from August 2026. Year-over-year, however, it declined 7.7% from September 2025. Furthermore, Metro Vancouver’s house benchmark stood at $1,784,700 in September 2026. Vancouver East houses therefore sit roughly $154,200 below that regional standard. Consequently, the city continues to offer meaningful value against the broader Metro average.
Browse Vancouver East houses listed under $1,630,500 here, or explore available options above $1,630,500.
Vancouver East Attached Homes (Townhomes & Duplexes):
The attached homes benchmark in Vancouver East reached $980,400 in September 2026. Month-over-month, the benchmark eased 0.5% from August. Additionally, it fell 7.9% year-over-year from September 2025. Metro Vancouver’s townhouse benchmark, meanwhile, stood at $1,016,700. Vancouver East attached homes therefore sit roughly $36,300 below that regional average. As a result, this segment remains priced closely in line with Metro Vancouver.
Search attached homes and townhomes in Vancouver East under $980,400 here, or view attached homes and townhomes above $980,400.
Vancouver East Condos:
The condo benchmark in Vancouver East reached $634,800 in September 2026. Month-over-month, the benchmark rose 1.0% from August. Year-over-year, however, it declined 5.2% from September 2025. Moreover, Metro Vancouver’s condo benchmark of $682,500 sits roughly $47,700 above Vancouver East. Specifically, this segment sits well below the regional condo benchmark.
Find Vancouver East condos listed under $634,800 here, or see all condos priced above $634,800.
Market Activity — Vancouver East
New listings of Vancouver East houses climbed to 222 in September 2026, up from 141 in August. Year-over-year, new house supply rose 5.2% from the 211 listed in September 2025. Active inventory stands at 692 houses. Attached (Townhomes and Duplexes) jumped to 274 new listings in September, up from 118 in August. Furthermore, new attached supply increased 9.6% year-over-year from 250 a year earlier. Active inventory for Vancouver East townhomes stands at 173 units. Meanwhile, Vancouver East condos saw new listings rise to 274 in September, up from 177 in August. Additionally, new condo supply fell 20.1% year-over-year from the 343 listed in September 2025. Active condo inventory stands at 551 units.
House sales in Vancouver East reached 65 in September 2026, up 14.0% year-over-year from 57 in September 2025. Subsequently, the sales-to-new-listings ratio (SNLR) reached 29.3%, indicating buyer’s market conditions. The sales-to-active-listings ratio for houses stood at 9.4%, closely matching Metro Vancouver’s 9.7% detached baseline.
Attached home sales totalled 57 in September 2026, an 11.8% increase year-over-year from 51 in September 2025. Moreover, the attached homes SNLR of 20.8% signalled buyer’s market conditions. Meanwhile, 16 townhouse sales against 173 active units produced a 9.2% townhouse sales-to-active-listings ratio, below Metro Vancouver’s 12.2% baseline.
Condo sales totalled 61 in September 2026, a 39.6% decline year-over-year from 101 in September 2025. Nevertheless, the condo SNLR of 22.3% pointed to buyer’s market conditions. Additionally, the condo sales-to-active-listings ratio of 11.1% closely matched Metro Vancouver’s 11.4% condo baseline.
- Check houses with open houses in Vancouver East here
- Browse townhomes with open houses in Vancouver East
- Find condos with open houses in Vancouver East
Vancouver West Real Estate — September 2026
Vancouver West cooled across every segment in September 2026, with house sales down year-over-year. Additionally, benchmark prices slipped month-over-month in all three property types.
Price Analysis — Vancouver West
Vancouver West Houses:
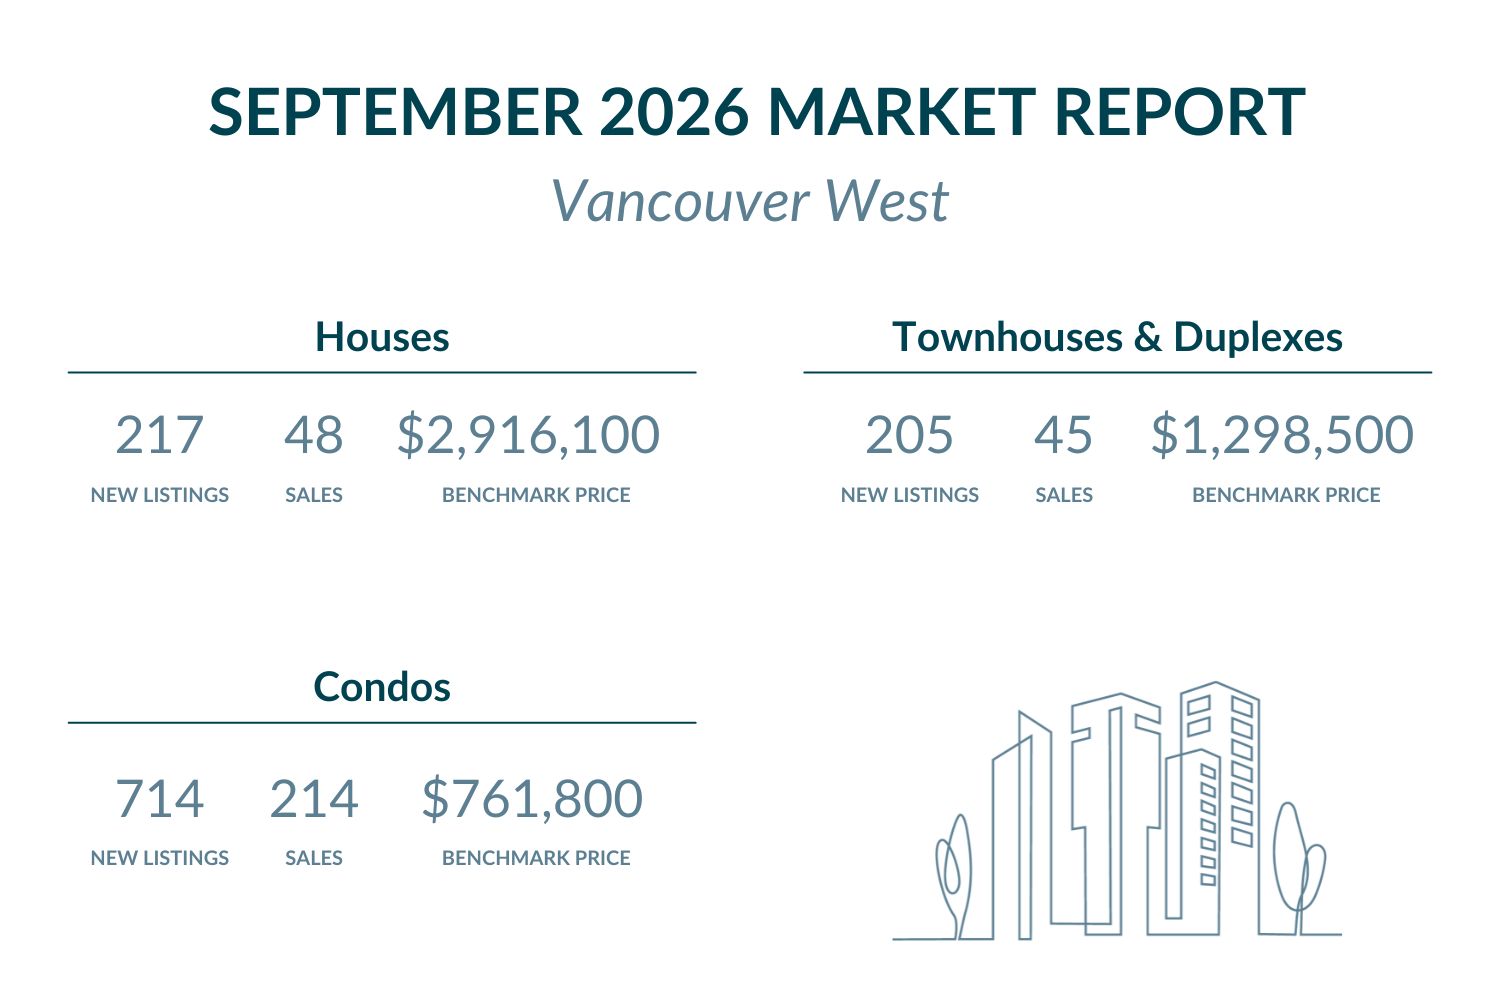
The benchmark price for houses in Vancouver West reached $2,916,100 in September 2026. Month-over-month, the benchmark eased 0.6% from August. Year-over-year, it declined 8.7% from September 2025. Furthermore, Metro Vancouver’s house benchmark stood at $1,784,700 in September 2026. Vancouver West houses therefore carry a premium of roughly $1,131,400 above that standard. Consequently, this segment remains substantially above regional norms.
Browse Vancouver West houses listed under $2,916,100 here, or discover available homes priced above $2,916,100.
Vancouver West Attached Homes (Townhomes & Duplexes):
The attached homes benchmark in Vancouver West reached $1,298,500 in September 2026. Month-over-month, the benchmark fell 2.7% from August. Year-over-year, it declined 5.5% from September 2025. Additionally, Metro Vancouver’s townhouse benchmark of $1,016,700 places Vancouver West attached homes $281,800 higher. As a result, this segment continues to reflect the city’s premium positioning.
Search attached homes and townhomes in Vancouver West under $1,298,500 here, or explore attached homes and townhomes above $1,298,500.
Vancouver West Condos:
The condo benchmark in Vancouver West reached $761,800 in September 2026. Month-over-month, the benchmark eased 1.7% from August. Year-over-year, it fell 5.2% from September 2025. Moreover, Metro Vancouver’s condo benchmark of $682,500 places Vancouver West condos roughly $79,300 higher. Specifically, this marks a moderate premium beside the far larger gap in houses.
Find Vancouver West condos listed under $761,800 here, or see all listings above $761,800.
Market Activity — Vancouver West
New listings of Vancouver West houses rose to 217 in September 2026, up from 142 in August. Year-over-year, new house supply fell 11.4% from the 245 listed in September 2025. Active inventory stands at 729 houses. Attached (Townhomes and Duplexes) climbed to 205 new listings in September, up from 134 in August. Year-over-year, however, new attached supply declined 6.0% from 218 a year earlier. Active inventory for Vancouver West townhomes stands at 350 units. Meanwhile, Vancouver West condos saw new listings increase to 714 in September, up from 501 in August. Furthermore, new condo supply dropped 13.7% year-over-year from the 827 listed in September 2025. Active condo inventory stands at 1,655 units.
House sales in Vancouver West totalled 48 in September 2026, down 14.3% year-over-year from 56 in September 2025. Subsequently, the sales-to-new-listings ratio (SNLR) for houses reached 22.1%, indicating buyer’s market conditions. The sales-to-active-listings ratio stood at 6.6%, below Metro Vancouver’s 9.7% detached baseline.
Attached home sales reached 45 in September 2026, a 28.6% increase year-over-year from 35 in September 2025. Moreover, the attached homes SNLR of 22.0% signalled buyer’s market conditions. Meanwhile, 30 townhouse sales against 350 active units produced an 8.6% townhouse sales-to-active-listings ratio, below Metro Vancouver’s 12.2% baseline.
Condo sales totalled 214 in September 2026, a 4.5% decline year-over-year from 224 in September 2025. Nevertheless, the condo SNLR of 30.0% still pointed to buyer’s market conditions. Additionally, the condo sales-to-active-listings ratio of 12.9% came in above Metro Vancouver’s 11.4% condo baseline.
- See houses with open houses in Vancouver West here
- Discover townhomes with open houses in Vancouver West
- Explore condos with open houses in Vancouver West
Metro Vancouver Market Context — September 2026
September 2026 saw Metro Vancouver sales slip further below the long-run seasonal norm. Regional sales totalled 1,717, down 8.4% from September 2025 and 25% under the ten-year average. According to Greater Vancouver REALTORS® (GVR), Andrew Lis noted that “the weakness is contained to the sizeable apartment segment.” Furthermore, he observed that “sales of attached and detached homes finished slightly up from last September.”
Additionally, Lis pointed to “the composite price index drifting down 0.5 percent month over month.” Moreover, he cited “price declines of about three per cent since the start of the year.” Specifically, the composite benchmark now stands at $1,075,900 across Metro Vancouver.
Metro Vancouver’s sales-to-active-listings ratios stood at 9.7% for houses, 12.2% for attached homes and 11.4% for condos. Vancouver East houses closely matched the detached baseline at 9.4%. However, Vancouver East townhouses posted 9.2%, below Metro’s 12.2% attached baseline. Condos in Vancouver East closely tracked the regional average at 11.1%. Meanwhile, Vancouver West houses trailed at 6.6% against the 9.7% baseline. The Vancouver West townhouse ratio of 8.6% likewise fell below Metro’s baseline. In contrast, Vancouver West condos reached 12.9%, above the 11.4% condo baseline.
Frequently Asked Questions — Vancouver Real Estate September 2026
Q: Are Vancouver home prices rising or falling in September 2026?
A:
Vancouver home prices moved in mixed directions in September 2026. In Vancouver East, house benchmarks rose 0.6% month-over-month while falling 7.7% year-over-year. Townhouses there eased 0.5% monthly and 7.9% annually. Condos gained 1.0% month-over-month, yet slipped 5.2% year-over-year. Across Vancouver West, every type declined on both measures. Houses fell 0.6% monthly and 8.7% annually, while condos dropped 1.7% and 5.2%.
Q: Is it a good time to buy Vancouver real estate in September 2026?
A:
September 2026 conditions favoured buyers across both cities. Every property type in both areas recorded a buyer’s market sales-to-new-listings ratio. Specifically, those ratios ranged from 20.8% to 30.0%. Additionally, sales-to-active-listings ratios stayed moderate throughout. Vancouver East houses posted 9.4%, while Vancouver West houses reached just 6.6%. Both sit far below the 20% threshold that signals upward price pressure. Consequently, buyers held wide selection and real negotiating room.
Q: Which Vancouver area offers better real estate value in September 2026?
A:
Vancouver East offers stronger relative value across every property type. House benchmarks there ($1,630,500) sit roughly $1,285,600 below Vancouver West ($2,916,100). Condos in Vancouver East ($634,800) are $127,000 more affordable than Vancouver West ($761,800). Furthermore, all three Vancouver East benchmarks fall below Metro Vancouver averages. Vancouver West, by contrast, commands a premium across houses, townhouses and condos.
Q: How does Vancouver East compare to Vancouver West for real estate investment?
A:
Both cities sat in buyer’s territory during September 2026, though their profiles diverged. Vancouver East combined rising house and attached sales with absorption near Metro baselines. Its house sales climbed 14.0% year-over-year, while attached sales gained 11.8%. However, Vancouver East condo sales fell 39.6% over the same period. Vancouver West saw attached sales jump 28.6%, yet house sales dropped 14.3%. Nevertheless, its condo absorption of 12.9% topped the regional 11.4% baseline.
Q: What are the best Vancouver communities to buy in September 2026?
A:
Both Vancouver East and Vancouver West present opportunities in September 2026, depending on budget. Vancouver East remains the value-focused choice, with all three benchmarks below Metro averages. Specifically, its house segment showed the firmer absorption of the two cities. Vancouver West suits buyers targeting premium houses and larger condo selection. Additionally, its condo inventory of 1,655 units gives purchasers unusually wide choice.
Featured Buildings