August 2024 presented a mix of market trends for the North Shore, covering both North Vancouver and West Vancouver. While some segments showed price decreases, certain areas experienced increased buyer activity.
North Vancouver – For Most Types, Year-Over-Year Prices Show a Slight Increase, While New Listings and Sales Ratios Have Decreased
Price Analysis:
In August 2024, North Vancouver’s prices benchmarks exceeded Metro Vancouver averages across all three property types, signifying its position as a higher-priced market.
House/Detached:
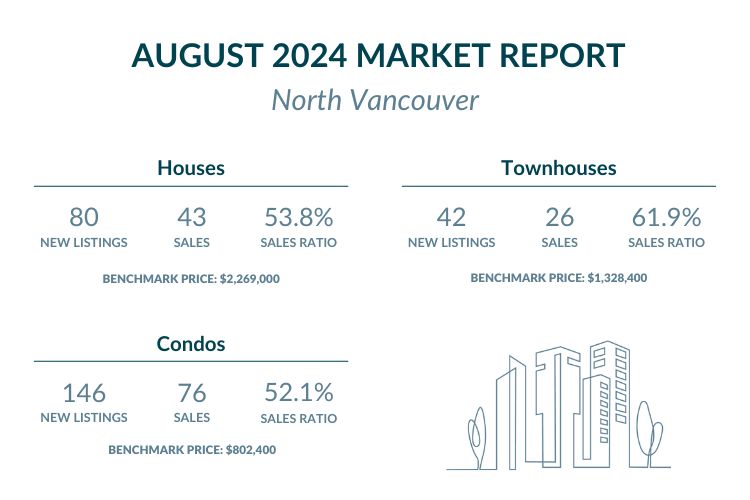
The benchmark price for houses in North Vancouver declined by 1.1% month-over-month, settling at $2,269,000 in August 2024. Despite this dip, house prices have increased by 1.6% compared to August 2023, also remaining well above the Metro Vancouver benchmark of $2,048,400.
Check out North Vancouver houses under $2,269,000 here, or find those priced over $2,269,000 here.
Townhouse/Attached:
Townhouse prices also fell by 1.8% from July 2024, bringing the benchmark to $1,328,400. Year-over-year, townhouses saw a slight increase of 1.1%. This is notably higher than the Metro Vancouver benchmark of $1,119,300, signalling North Vancouver’s elevated price range for townhomes.
Explore North Vancouver townhomes under $1,328,400 here, discover townhouses priced over $1,328,400 here.
Condo/Apartments:
Condos experienced a 1.5% price drop from July 2024, with a benchmark price of $802,400 in August 2024, down 0.9% compared to the same period last year. This price is above the Metro Vancouver benchmark of $768,200, reflecting North Vancouver’s continued demand for condo living.
Browse North Vancouver condos under $802,400 here and view apartments over $802,400 here.
New Listings and Sales:
In August 2024, new house listings in North Vancouver dropped sharply to 80, down from 153 in July, marking a 6.3% decrease compared to August 2023. Townhouse listings experienced an even steeper decline, with only 42 new listings, reflecting a 23.8% year-over-year drop. In contrast, condo listings rose by 21.2%, climbing to 146 in August 2024 from 115 the previous year.
Sales activity painted a mixed picture. House sales in North Vancouver fell to 43 in August 2024, down from 69 in July. Despite this decline, the sales ratio surged to 53.8%, a 23.5% increase year-over-year, indicating robust demand. This performance far outpaced Metro Vancouver’s detached home sales ratio of 9.6%. Townhouse sales also decreased, with 26 units sold in August from 38 in July, resulting in a sales ratio of 61.9%. Although this reflected a 15.3% drop compared to August 2023, townhouses in North Vancouver still outperformed Metro Vancouver’s average sales ratio of 18%.
Condo sales saw a decline as well, with 76 units sold in August 2024, down from 94 in July. The sales ratio for condos stood at 52.1%, representing a significant 29.6% year-over-year decrease. However, North Vancouver’s condo market continued to perform strongly when compared to Metro Vancouver’s 17.2% sales ratio, highlighting the area’s resilience in the face of broader market challenges.
North Vancouver followed the trend seen in other areas of Metro Vancouver for most types, experiencing a decrease in sales in August 2024 compared to August 2023. This aligns with the general trend of declining sales observed across Metro Vancouver, suggesting a shared market influence.
West Vancouver – Year-over-year Property Prices Rise Across All Types, New Listings Decline, and Sales Ratios Increase – Except for Townhomes
Price Analysis:
Despite some recent price adjustments in August 2024, North Vancouver’s benchmark prices increase for all property types and remain notably higher than the Metro Vancouver average.
House/Detached:
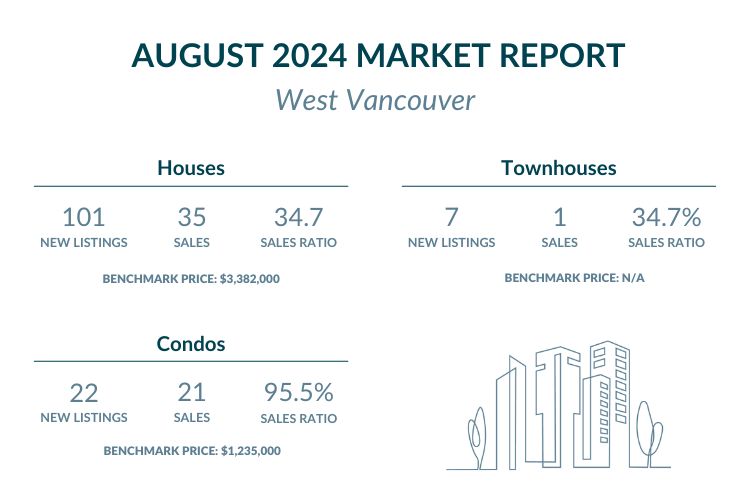
West Vancouver continues to be a premium market, with the benchmark price for detached homes at $3,382,000 in August, an increase of 1.6% from July. Year-over-year, house prices rose by 3.8%. This is well above the Metro Vancouver benchmark price of $2,048,400, reaffirming West Vancouver’s position as one of the priciest areas in the region.
Explore Vancouver West homes under $3,382,000 right here, or uncover options priced over $3,382,000 here.
Condo/Apartments:
Condo prices, however, declined by 3.7% from July 2024, with a benchmark price of $1,235,000. Despite the monthly decline, condos are up by 1.4% compared to August 2023. While still much higher than the Metro Vancouver benchmark of $768,200, the West Vancouver condo market remains competitive.
See West Vancouver condos under $1,235,000 here, and uncover prices over $1,235,000 here.
New Listings and Sales:
In August 2024, West Vancouver experienced a notable decrease in new property listings. House listings fell to 101, down from 147 in July, marking a year-over-year decline of 5.9%. Townhouse listings dropped even more dramatically, with only 7 new listings—an alarming 28.6% decrease compared to August 2023. Condos also saw a significant decline, with only 22 new listings in August from 43 in July, reflecting a steep 40.9% drop from the same month last year.
Despite the decrease in listings, house sales in West Vancouver remained relatively stable, with 35 units sold in August, slightly down from 36 in July. The sales ratio for houses was 34.7%, representing a 9.1% increase from August 2023. This indicates a healthier market compared to the broader Metro Vancouver area, which reported a sales ratio of just 9.6%.
In contrast, townhouse sales plummeted, with only 1 unit sold in August, resulting in a sales ratio of 14.3%—a staggering 74.3% decrease year-over-year. On a more positive note, condo sales rose to 21 units in August, up from 16 in July. This surge resulted in an impressive sales ratio of 95.5%, which signifies a remarkable 74.1% increase compared to the previous year. The demand for condos in West Vancouver significantly outpaces that in Metro Vancouver, where the sales ratio sits at only 17.2%.
West Vancouver’s real estate market exhibits unique characteristics compared to the overall Metro Vancouver market. While sales activity in West Vancouver has remained relatively stable, Metro Vancouver has experienced a decline.
Shifting towards buyer’s market, with more inventory and lower sales-ratio
The August 2024 real estate market data suggests a period of adjustment in North Vancouver, West Vancouver, and Metro Vancouver. North Vancouver generally reflects the overarching trends seen in Metro Vancouver’s real estate market, including declining sales across property types and a shift towards a more balanced market, moving away from the strong seller’s market experienced in recent years. While West Vancouver continues to command the highest prices in the region and saw an increase in sales-ratio.
However, despite a decrease in sales ratios compared to August 2023 for North Vancouver, activity levels remain notably higher for both North and West Vancouver than the Metro Vancouver average. The average sales ratios for detached houses, townhomes, and condos were 9.6%, 18%, and 17.2%, respectively.
The recent policy rate cut injects uncertainty into the market’s future. While it could incentivize buyers, its impact on both pricing and sales volume in Northshore, in comparison to Metro Vancouver, remains to be seen. The fall market will likely reveal more about how these areas will be affected.
Featured Buildings


