June 2024 brought a mix of minor fluctuations and significant changes in the real estate market across North Vancouver and West Vancouver. Similar to Vancouver Market, North Shore’s market is shifting in buyer’s favour, though hesitation remains.
North Vancouver – Highest Sales Ratios in North Shore with Rise in Prices
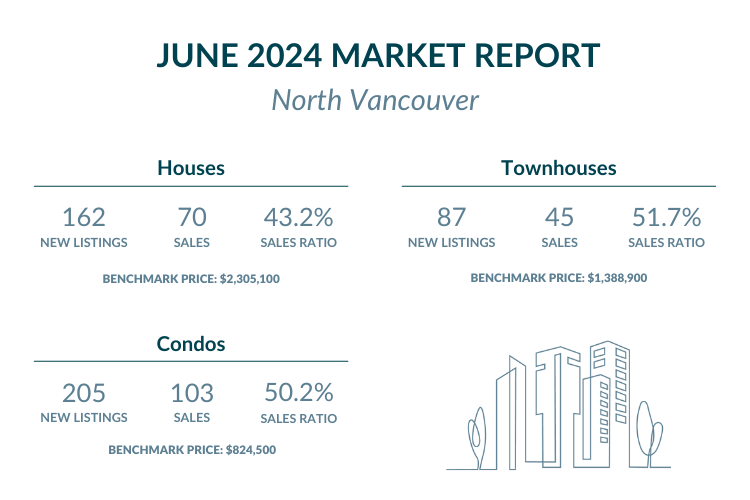
While Metro Vancouver’s average sales ratio hovers in the low 20% range, North Vancouver stands out on the North Shore with the highest sales ratio, maintaining a dynamic market where sales ratios exceed 40% and approached 50% for condos, alongside notable benchmark price increases compared to previous periods.
Price Analysis:
House/Detached:
The benchmark price for houses in North Vancouver stood at $2,305,100 in June 2024, reflecting a slight increase of 0.2% from May 2024. Compared to June 2023, house prices have risen by 3.0%.
Browse North Vancouver houses under $2,350,100 here, or explore those priced over $2,305,100 here.
Townhouse/Attached:
The benchmark price for townhouses decreased by 2.6% from May 2024, now at $1,388,900. Year-over-year, townhouse prices have appreciated by 4.5%.
Discover North Vancouver townhomes under $1,388,900 here, or find townhouses priced over $1,388,900 here.
Condo/Apartments:
Condo prices saw a marginal increase of 0.1%, bringing the benchmark price to $824,500. Over the past year, condo prices have grown by 1.6%.
Explore North Vancouver condos under $824,500 here and check out apartments over $824,500 here.
New Listings and Sales:
In June 2024, North Vancouver saw 162 new house listings, a decrease of 8.5% from May 2024 but an increase of 4.9% compared to June 2023. Similarly, new townhouse listings totalled 87, down from 126 in May 2024 but significantly up by 37.9% from 54 in June 2023. Condo new listings in North Vancouver were 205, a drop from 229 in May 2024, yet a 12.2% increase year-over-year.
House sales in June 2024 amounted to 70, down from 98 in May 2024, with a sales ratio of 43.2%, reflecting a 25.2% decline compared to June 2023. In contrast, townhouse sales increased to 45 from 39 in May 2024, despite the sales ratio for June 2024 at 51.7% showing a 20.2% decline year-over-year. Condo sales reached 103, down from 108 in May 2024, with a sales ratio of 50.2%, marking a 25.9% decrease from June 2023. These trends indicate fluctuating market dynamics with varying performance across different property types.
West Vancouver – Lower Sales Ratios in North Shore but Higher then Average Sales Ratios
Price Analysis:
House/Detached:
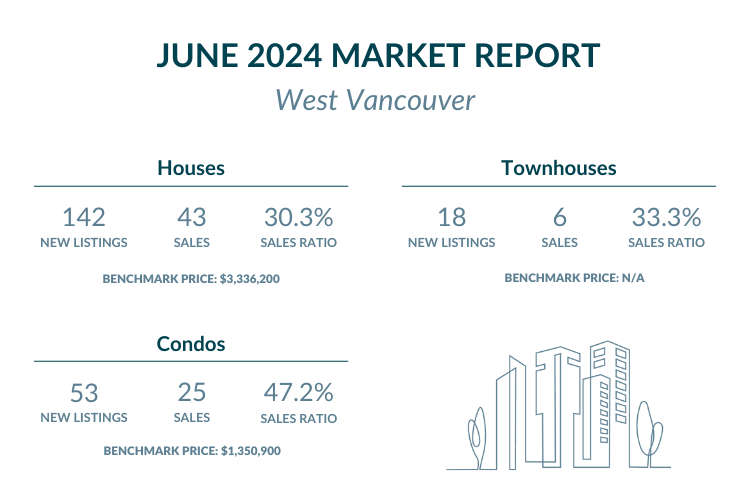
The benchmark price for houses in West Vancouver slightly decreased by 0.3% from May 2024, reaching $3,336,200. Year-over-year, house prices have increased by 3.6%.
Look into West Vancouver houses under $3,336,200 here, or discover single homes priced over $3,336,200 here.
Condo/Apartments:
The benchmark price for condos rose by 0.7% to $1,350,900 in June 2024, remaining unchanged compared to June 2023.
Uncover West Vancouver condos under $1,350,900 here, and see priced over $1,350,900 here.
New Listings and Sales:
In June 2024, West Vancouver saw 142 new house listings, a decrease of 19.3% from May 2024 and a 4.9% drop compared to June 2023. New townhouse listings rose to 18, up from 11 in May 2024, marking a substantial year-over-year increase of 72.2% from 5 in June 2023. Similarly, condo new listings in West Vancouver fell to 53, down from 70 in May 2024, and a 13.2% decrease compared to June 2023.
House sales in June 2024 reached 43, an increase from 34 in May 2024, with a sales ratio of 30.3%, showing a 61.1% rise compared to June 2023. Townhouse sales remained stable at 6 for both May and June 2024, but the sales ratio for June 2024 is 33.3%, reflecting a 72.2% decrease compared to June 2023. Condo sales in June 2024 were 25, slightly down from 26 in May 2024, with a sales ratio of 47.2%, representing a 28.6% increase compared to June 2023. These figures highlight mixed trends in the West Vancouver market, with significant variations across different property types.
Conclusion
The real estate market in North Vancouver and West Vancouver for June 2024 reveals varied trends. North Vancouver saw a modest rise in house and condo prices, while townhouse prices experienced a slight decline. New listings for houses and condos saw a year-over-year increase, while townhouse listings surged significantly. However, sales ratios for all property types declined compared to the previous year. While the sales ratios are down compared to June 2023, its sales activities are much higher than the Metro Vancouver average. The average sales ratio for detached houses, townhomes and condos were 13.1%, 21.1% and 20.3%, respectively.
In West Vancouver, house prices saw a slight dip, while condo prices edged up. New listings for houses and condos decreased year-over-year, whereas townhouse listings saw a substantial increase. House sales increased notably, while condo sales experienced a smaller rise, and townhouse sales remained flat.
As we move further into 2024, keeping an eye on these dynamics will be crucial for understanding the evolving real estate landscape in North Shore.
Featured Buildings


