As we move deeper into the summer of 2024, the Vancouver real estate market presents a dynamic landscape with some interesting trends. Both Vancouver East and Vancouver West have shown general slight drop in prices, growth in new listings and decline in sales. Even though there are more selections in the market it’s not translating to more transactions.
Vancouver East – Higher Average Sales Ratios with Modest Price Increases
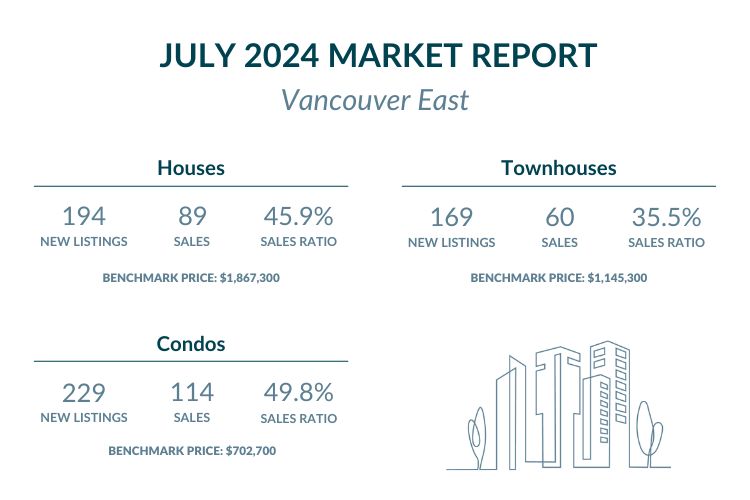
Vancouver East displayed higher average sales ratios, exceeding 35% and nearly reaching 50% for condos, while Metro Vancouver’s average sales ratio remained below 20%. Benchmark prices saw a modest increase compared to July 2023.
Price Analysis:
House/Detached:
The benchmark price for houses in Vancouver East in July 2024 was $1,867,900. This represents a 1.3% increase from June 2024, but a year-over-year decline of 1.2% compared to July 2023.
Find Vancouver East single family homes priced under $1,867,900 here, or priced over $1,867,900 here.
Townhouse/Attached:
Townhouse prices saw a slight dip of 0.2% from June 2024, with a benchmark price of $1,145,300 in July 2024. On a yearly basis, townhouse prices decreased by 0.2%.
Browse Vancouver East townhouses priced under $1,145,300 here, or find those over $1,145,300 here.
Condo/Apartments:
The benchmark price for condos dropped by 1.2% from June 2024 to $702,700 in July 2024. Compared to July 2023, condo prices fell by 1.3%.
Check out Vancouver East condos under $702,700 here, or view those priced over $702,700 here.
New Listings and Sales:
In July 2024, Vancouver East saw a slight decrease in new house listings, totaling 194, down from 211 in June 2024, yet marking a 19.6% increase compared to July 2023 (156 new listings). Similarly, new townhouse listings in Vancouver East fell to 169, down from 178 in June, but still represented a 30.2% year-over-year rise (118 new listings in July 2023). Condo listings in Van East followed the trend, with a minor decline to 229 in July, slightly down from 257 in June, and a marginal 0.9% decrease year-over-year (231 new listings in July 2023).
Despite the drop in new listings, house sales in Vancouver East increased to 89 in July 2024, up from 75 in June. However, the sales ratio dropped by 20.5% year-over-year, settling at 45.9%. Townhouse sales, on the other hand, fell to 60 in July, down from 67 in June, with the sales ratio plummeting 38.4% year-over-year to 35.5%. Condo sales also declined to 114, down from 127 in June, with the sales ratio at 49.8%, reflecting a 9.5% decrease compared to July 2023. This combination of rising listings and declining sales ratios suggests a cooling trend in the Vancouver East market, possibly pointing to a shift towards a more balanced or buyer-friendly environment.
Vancouver West – Average Sales Ratios over 30% with Fair Price Rise
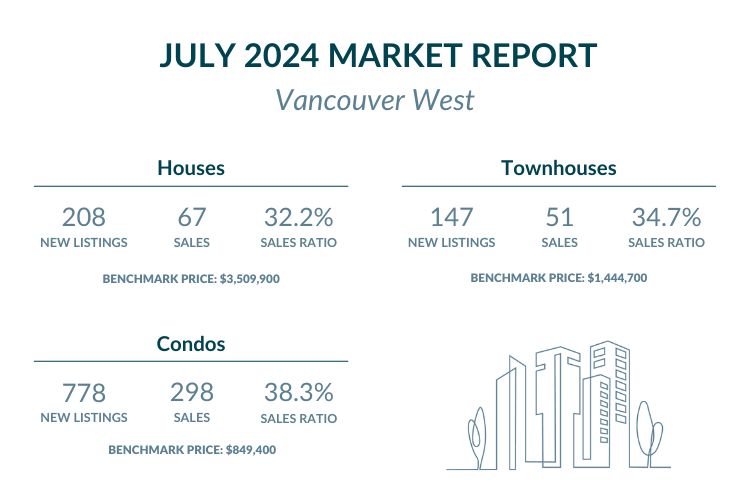
Following Vancouver East, Vancouver West also reported higher average sales ratios, surpassing 30% and approaching 40% for condos, while Metro Vancouver’s average sales ratio stayed below 20%. Benchmark prices experienced a modest increase compared to July 2023.
Price Analysis:
House/Detached:
In Vancouver West, the benchmark price for houses decreased by 1.4% from June 2024, settling at $3,509,900 in July 2024. However, on a yearly basis, house prices have increased by 1.6%.
See Vancouver West homes under $3,509,900 right here, or uncover options priced over $3,509,900 here.
Townhouse/Attached:
Townhouse prices saw a notable decline of 3.2% from June 2024, with a benchmark price of $1,444,700 in July 2024. Year-over-year, townhouse prices fell by 1.0%.
Search townhomes in Vancouver West under $1,444,700 here, or browse those priced over $1,444,700 here.
Condo/Apartments:
The benchmark price for condos in Vancouver West was $849,400 in July 2024, a slight decrease of 0.1% from June 2024 and a 1.2% decline compared to July 2023.
Explore condos Vancouver West for under $849,400 in Vancouver West here and discover options priced over $849,400 here.
New Listings and Sales:
In Vancouver West, new house listings in July 2024 totaled 208, a slight decrease from 224 in June, yet reflecting a 15.9% year-over-year increase (175 new listings). Similarly, townhouse new listings dropped to 147 from 172 in June but were still up 14.3% compared to July 2023 (126 new listings). Condo new listings remained steady at 778 in both June and July 2024, marking a 7.3% increase year-over-year (721 new listings in July 2023).
Despite these listing trends, house sales in Vancouver West declined to 67 in July 2024, down from 83 in June, with the sales ratio falling by 18.3% year-over-year to 32.2%. Townhouse sales followed a similar pattern, dropping to 51 in July from 59 in June, with a sales ratio of 34.7%, a slight 0.6% decline year-over-year. Condo sales also saw a decrease, falling to 298 in July from 327 in June, with the sales ratio at 38.3%, reflecting a 15.0% drop compared to July 2023. This combination of increased listings and declining sales ratios suggests a softening market in Vancouver West, potentially signalling a shift toward more favourable conditions for buyers.
Conclusion
The Vancouver real estate market in July 2024 shows similar performance across Vancouver East and Vancouver West. Vancouver saw a general decline in property values across all types. The number of new listings is generally higher than last year, indicating an active market, but sales ratios have declined in most segments, suggesting a cooling in buyer activity compared to 2023.
As we move into the latter half of the year, these trends highlight the importance of strategic pricing and marketing for sellers and the need for buyers to stay informed about shifting market dynamics.
Featured Buildings


