As the summer months come to a close, Vancouver’s real estate market in August 2024 reflects both unique local dynamics and trends consistent with the broader Metro Vancouver market. Changes in pricing, new listings, and sales activity highlight a dynamic market with some sectors cooling while others remain stable.
Vancouver East – Year-Over-Year Prices Dip Across Most Types, New Listings Rise, but Sales Ratios Decline
Price Analysis:
In August 2024, Vancouver East Side townhouses price benchmark were slightly above than the Metro Vancouver average price benchmark, while detached homes and apartments recorded below Metro Vancouver’s benchmark.
House/Detached:
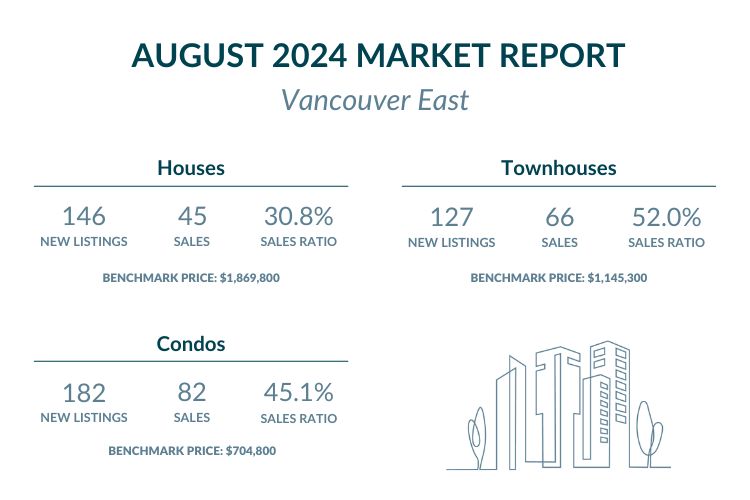
The benchmark price for houses remained relatively stable, rising by 0.1% from July to August, reaching $1,869,800. Year-over-year, house prices have seen an increase of 0.7%, reflecting broader market adjustments. In comparison, the benchmark price for detached homes across Metro Vancouver was significantly higher at $2,048,400.
Discover Vancouver East single family homes priced under $1,869,800 here, or priced over $1,869,800 here.
Townhouse/Attached:
Townhouses saw a moderate monthly increase of 0.7%, with the benchmark price at $1,153,600. Compared to August 2023, townhouse prices dipped slightly by 0.9%. This puts local townhouse prices above Metro Vancouver’s benchmark of $1,119,300, showing a similar trend but maintaining a slightly higher price level.
See Vancouver East townhouses priced below $1,153,600 here, or find those above $1,153,600 here.
Condo/Apartments:
Condos experienced a slight monthly price increase of 0.3%, with the benchmark price now at $704,800, but still below the Metro Vancouver average of $768,200. Compared to the previous year, condo prices in East Van have decreased by 1.8%.
Find Vancouver East condos priced below $704,800 here, or those above $704,800 here.
New Listings and Sales:
In August 2024, 146 new house listings were recorded in East Van, a drop from 194 in July but still 4.1% higher than August 2023. Similarly, townhouse new listings in Vancouver East declined to 127 from 169 in July, though they saw a significant 38.6% year-over-year increase. Condo new listings in East Van also fell, with 182 in August compared to 229 in July, yet they managed an 11.0% rise compared to August 2023.
Vancouver East experienced a sharp decline in detached home sales, with only 45 homes sold, a 43.8% decline year-over-year, resulting in a sales ratio (SNLR) of 30.8%. In contrast, townhouse sales in East Van were more robust, with 66 units sold, a 53.5% from August 2023, achieving a sales ratio (SNLR) of 52.0%. Condo sales in Vancouver East also saw a decline, with 82 units sold, a 35.4% decrease from August 2023, and a sales ratio (SNLR) of 45.1%.
This trend of decreasing sales from all types aligns with the overall trend observed in Metro Vancouver. Both Vancouver East Side and Metro Vancouver are experiencing a shift toward balanced market conditions.
Vancouver West – Year-Over-Year Prices Dip Across All Property Types, New Listings Decrease for Most, and Sales Ratios Decline Overall
Price Analysis:
In August 2024, Vancouver West Side surpassed Metro Vancouver in price benchmarks across all three property types, indicating its higher-end market position.
House/Detached:
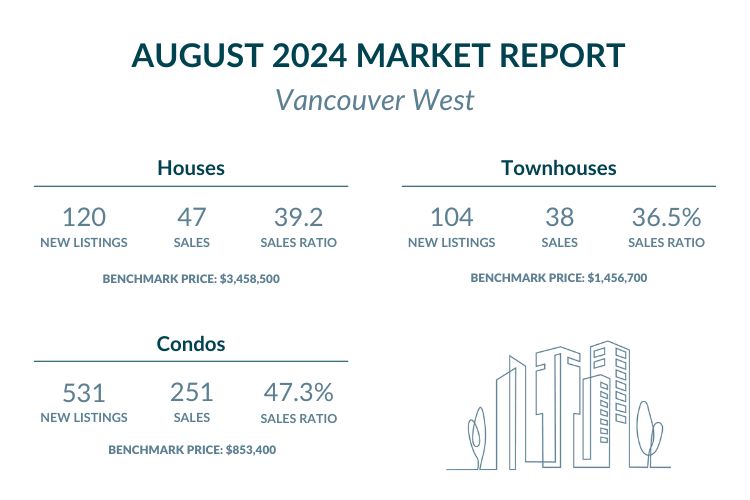
In Vancouver West, house prices declined by 1.4% month-over-month, with the benchmark price at $3,458,500. This is notably higher than the Metro Vancouver benchmark of $2,048,400, highlighting the premium associated with Vancouver West properties. Year-over-year, house prices fell by 1.8%, indicating a cooling market for luxury homes.
Explore Vancouver West homes under $3,458,500 right here, or uncover options priced over $3,458,500 here.
Townhouse/Attached:
Townhouse prices saw a small increase of 0.8% from July 2024, reaching $1,456,700 in August 2024, though they were down by 0.4% year-over-year. Still this benchmark was well above the Metro Vancouver benchmark of $1,119,300.
Discover townhomes in Vancouver West under $1,456,700 here, or browse those priced over $1,456,700 here.
Condo/Apartments:
Condos in Vancouver West recorded a modest price increase of 0.3% month-over-month to $853,400, but like other segments, condo prices dropped by 1.8% compared to August 2023, and again higher than the Metro Vancouver benchmark of $768,200.
See condos Vancouver West for under $853,400 in Vancouver West here and discover options priced over $849,400 here.
New Listings and Sales:
In August 2024, new house listings in Vancouver West saw a significant decline, dropping to 120 from 208 in July, and reflecting a 17.5% decrease compared to August 2023. Townhouse listings followed a similar trend, with 104 new listings in August, down from 147 in July. However, this still represented a slight 2.9% year-over-year increase. Meanwhile, condo listings fell sharply to 531 in August 2024 from 778 in July, marking a 9.0% decline compared to the same period the previous year.
Sales activity mirrored the downward trend in listings. House sales in Vancouver West decreased to 47 in August 2024, down from 67 in July, representing a 31.9% decrease year-over-year, and a sales ratio (SNLR) of 39.2%. Townhouse sales also fell, with 38 units sold in August, down from 51 in July, reflecting an 15.6% year-over-year decrease. Despite this, the sales ratio (SNLR) remained robust at 36.5%. Condo sales followed suit, with 251 units sold in August 2024 compared to 298 in July, with a 21.3% decrease from previous year. The sales ratio for condos was 47.3%.
This mirrors the broader Metro Vancouver trend of shrinking sales, suggesting a shared market influence. Both Vancouver West Side and Metro Vancouver are moving towards a more balanced market, characterised by buyers and sellers having more equal influence.
Shifting towards buyer’s market, with more inventory and lower sales-ratio
Both Vancouver East Side and Vancouver West Side generally reflect the overarching trends seen in Metro Vancouver’s real estate market. This includes declining sales across property types and a shift towards a more balanced market, moving away from the strong seller’s market experienced in recent years.
The recent policy rate cut injects uncertainty into the market’s future. While it could incentivize buyers, its impact on both pricing and sales volume in Vancouver East and West Side, in comparison to Metro Vancouver, remains to be seen. The fall market will likely reveal more about how these areas will be affected.
Featured Buildings


