Vancouver Real Estate September 2025 | Vancouver East & Vancouver West Market
Written by Lynn Le Drew
Vancouver East Real Estate September 2025 – Mixed Conditions Across Property Types
Vancouver East real estate market showed varied performance throughout September 2025. Therefore, this created different opportunities depending on property type and buyer preferences.
Vancouver East Housing Market Price Analysis:
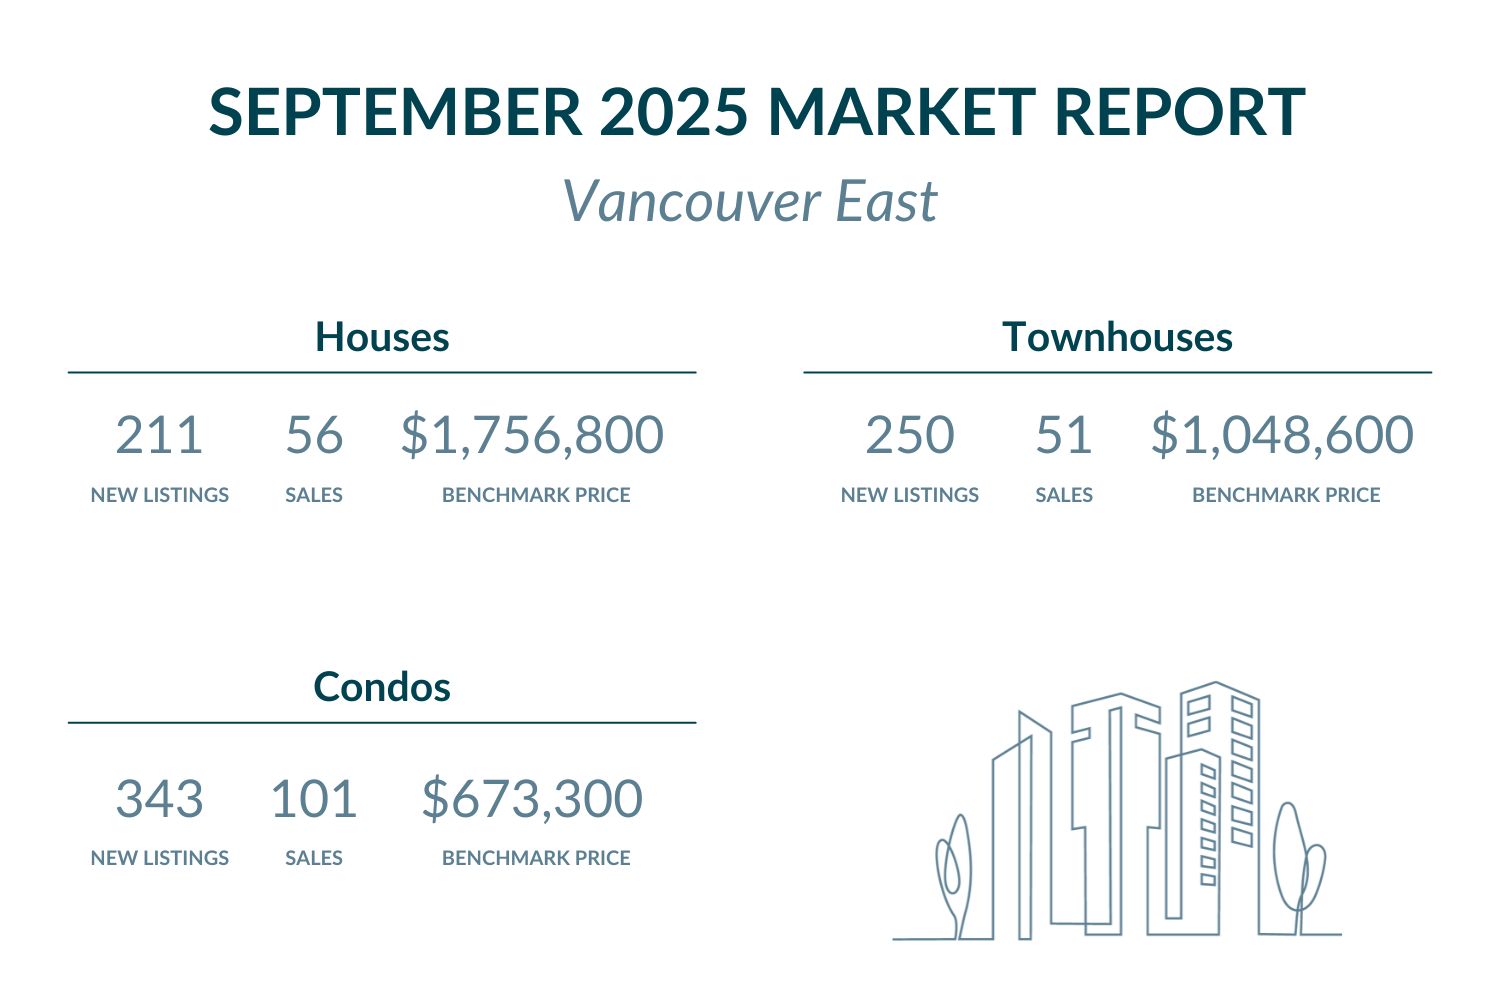
Vancouver East Detached Homes / Houses:
The benchmark price for houses increased modestly by 1.0% month-over-month to $1,756,800. However, year-over-year prices decreased 5.2% compared to September 2024. Currently, Vancouver East remains below Metro Vancouver’s benchmark of $1,933,100. Specifically, this provides approximately $176,300 discount from regional averages.
Browse Vancouver East houses under $1,760,000 here, or explore available options above $1,760,000.
Vancouver East Townhouses / Attached Homes:
The benchmark price for townhouses declined 2.7% from August to $1,048,600. Additionally, year-over-year prices dropped 3.2% from September 2024. Currently, Vancouver East stays just below Metro Vancouver’s benchmark of $1,069,800. As a result, this represents approximately $21,200 marginal discount from regional standards.
Explore Vancouver East townhomes listed below $1,050,000 here, or check out exclusive properties above $1,050,000.
Vancouver East Condos / Apartments:
The benchmark price for condos declined 0.8% from August to $673,300. Moreover, year-over-year prices fell 5.0% compared to September 2024. Currently, Vancouver East stays below Metro Vancouver’s benchmark of $728,800. Therefore, this provides approximately $55,500 value advantage over regional averages.
Search Vancouver East condos priced below $675,000 here, or view high-end listings above $675,000.
Vancouver East Real Estate Market Activity:
New listings displayed divergent trends across property segments. House new listings increased to 211 in September, up from August’s 141, though representing a 4.7% year-over-year decrease from September 2024. Townhome new listings reached 250, up significantly from August’s 142. Furthermore, this marked a solid 11.2% increase year-over-year. Condo new listings totaled 343, jumping from August’s 175, showing a 5.0% year-over-year increase. Active inventory in September was 629 for detached homes, and 654 for attached homes (townhouses and condos).
Sales activity showed divergent patterns across property types. House sales totaled 56 with a 26.5% sales-to-new-listings ratio, indicating buyer’s market conditions with significant negotiating power for purchasers. Townhome sales reached 51, producing a 20.4% sales-to-new-listings ratio, reflecting buyer’s market conditions. Condo sales totaled 101, yielding a 29.4% sales-to-new-listings ratio, suggesting buyer’s market conditions persisting. Additionally, the sales-to-active-listings ratio for houses reached 10.3%, slightly exceeding Metro Vancouver’s 8.5% baseline. For attached homes combined (townhouses and condos), the sales-to-active-listings ratio achieved 15.9%, outperforming the regional market. These ratios indicate varied market dynamics with houses showing stronger relative demand compared to regional averages while attached homes demonstrate modest outperformance.
View all houses with open houses in Vancouver East here, browse townhomes with open houses here, or explore condos with open houses here.
Vancouver West Real Estate September 2025 – Premium Market Adjusts to Buyer Conditions
Vancouver West real estate market maintained premium positioning while adapting to buyer-friendly conditions throughout September 2025. Consequently, this reinforced ongoing price adjustments in the luxury segment.
Vancouver West Housing Market Price Analysis:
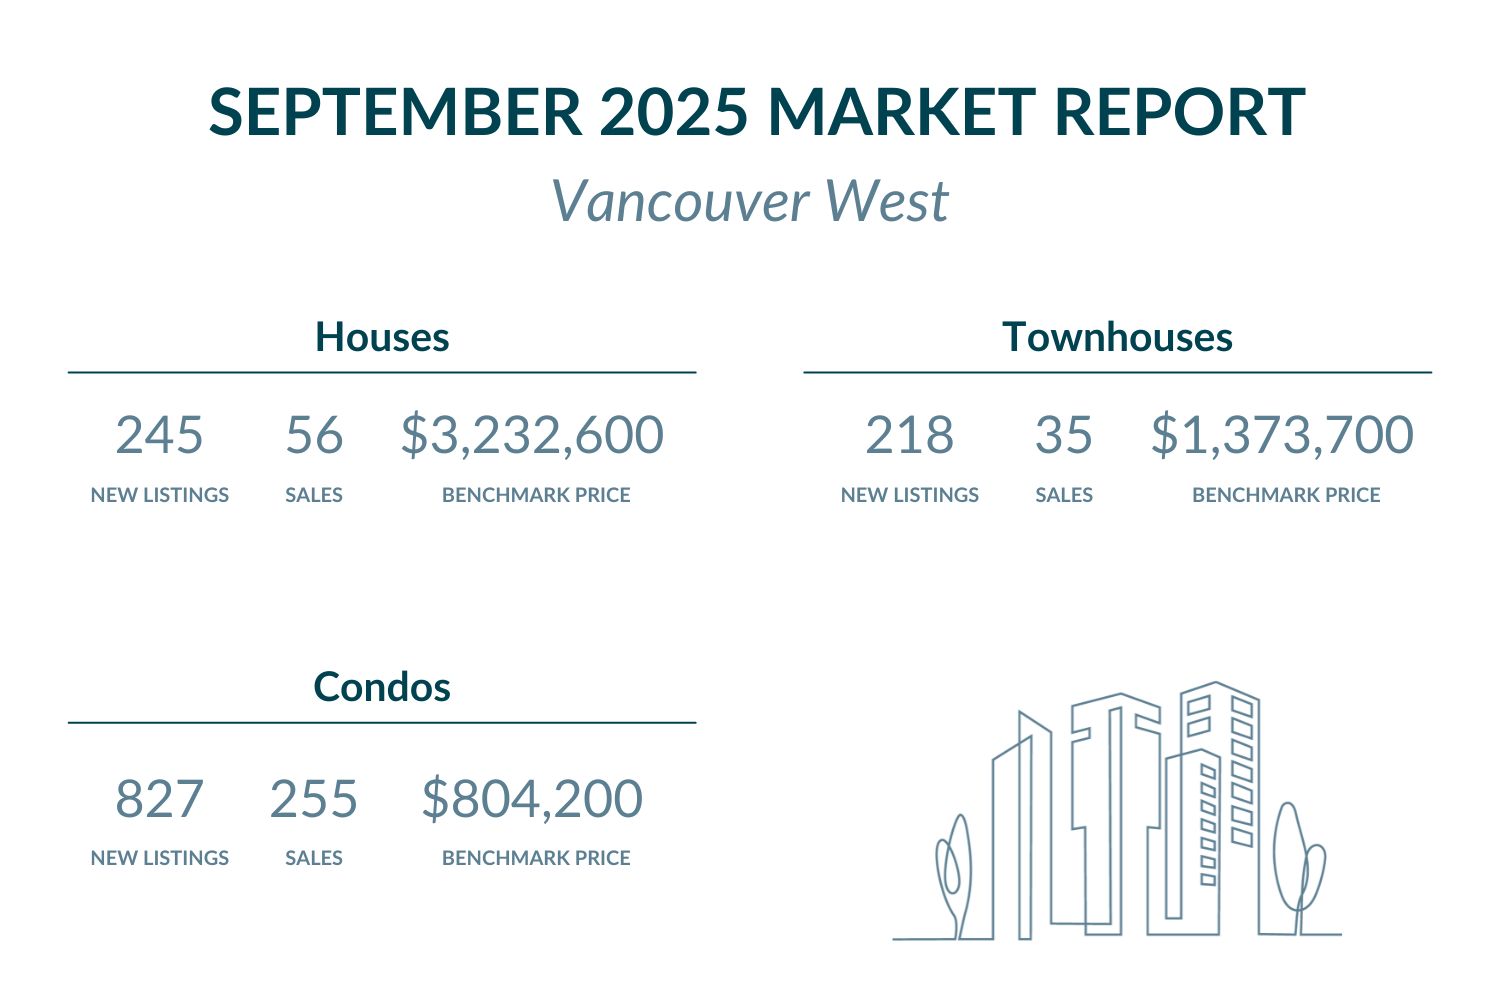
Vancouver West Detached Homes / Houses:
The benchmark price for houses increased 1.0% month-over-month to $3,232,600. However, year-over-year prices decreased 6.9% from September 2024. Currently, Vancouver West significantly exceeds Metro Vancouver’s benchmark of $1,933,100. Moreover, this commands a substantial premium of approximately $1,299,500.
Browse Vancouver West houses listed under $3,235,000 here, or explore upscale options above $3,235,000.
Vancouver West Townhouses / Attached Homes:
The benchmark price for townhouses declined 1.5% from August to $1,373,700. Similarly, year-over-year prices dropped 3.0% from September 2024. Specifically, Vancouver West substantially exceeds Metro Vancouver’s benchmark of $1,069,800. As a result, this commands approximately $303,900 premium above regional standards.
Check out Vancouver West townhomes available under $1,375,000 here, or explore luxury properties exceeding $1,375,000.
Vancouver West Condos / Apartments:
The benchmark price for condos decreased marginally by 0.1% from August to $804,200. Additionally, year-over-year prices fell 4.1% from September 2024. Currently, Vancouver West remains above Metro Vancouver’s benchmark of $728,800. Therefore, this represents approximately $75,400 premium over regional averages.
View Vancouver West condos listed below $805,000 here, or check out high-end selections above $805,000.
Vancouver West Real Estate Market Activity:
New listings showed mixed movements across property segments. House new listings increased to 245 from August’s 149. Meanwhile, this marked a modest 1.6% increase year-over-year. Townhome new listings reached 218, up substantially from August’s 122. Nevertheless, this reflected a solid 11.0% increase year-over-year. Condo new listings totaled 827, jumping sharply from August’s 493, though representing a 4.1% decline year-over-year. Active inventory in September was 727 for detached homes, and 2,134 for attached homes (condos and townhouses).
Sales activity demonstrated clear buyer’s market conditions across all property types. House sales totaled 56 with a 22.9% sales-to-new-listings ratio, indicating buyer’s market conditions with significant negotiating opportunities. Townhome sales reached 35, producing a 16.1% sales-to-new-listings ratio, reflecting pronounced buyer’s market conditions. Condo sales led with 225 transactions, yielding a 27.2% sales-to-new-listings ratio, suggesting buyer’s market conditions. Additionally, the sales-to-active-listings ratio for houses reached 7.6%, below Metro Vancouver’s 8.5% baseline. For attached homes combined (condos and townhouses), the sales-to-active-listings ratio achieved 14.3%, outperforming the regional market. These ratios demonstrate consistent buyer-favorable dynamics across property types, with luxury detached homes showing particularly soft conditions while attached homes (townhouses and condos combined) maintain slightly stronger relative performance.
View all houses with open houses in Vancouver West here, browse townhomes with open houses here, or explore condos with open houses here.
Metro Vancouver Market Context – Buyer-Friendly Fall Market Emerges
September 2025 confirmed that favorable conditions for homebuyers continued across Metro Vancouver. According to Greater Vancouver REALTORS®, Andrew Lis noted: “With another cut to Bank of Canada’s policy rate behind us, and markets pricing in at least one more cut by the end of the year, Metro Vancouver homebuyers have reason to be optimistic about the fall market.” Additionally, he emphasized: “Easing prices, near-record high inventory levels, and increasingly favourable borrowing costs are offering those looking to purchase a home this fall with plenty of opportunity.”
Furthermore, Lis observed: “The past few years have been quite challenging for the market, beginning with 2022’s rapid increase in interest rates, major political and policy shifts in subsequent years, and recent trade tensions with the USA weighing on the market. With the acute impacts of these events now fading, we expect market activity to continue stabilizing to end the year, barring any unforeseeable major disruptions.”
Metro Vancouver’s sales-to-active-listings ratios stood at 8.5% for detached homes, 12.7% for townhouses, and 13.3% for apartments. Vancouver East demonstrated mixed performance with houses at 10.3% (above Metro), and attached homes combined (condos and townhomes) at 15.9% (outperforming the regional market), indicating relatively stronger demand in these segments. Meanwhile, Vancouver West recorded softer conditions with houses at 7.6% (below Metro) and attached homes combined (condos and townhomes) at 14.3% (slightly outperforming the regional market). Both communities reflect the broader buyer-friendly market conditions, with inventory levels providing increased selection and negotiating power for purchasers.
Therefore, both Vancouver communities continue demonstrating the region’s shift toward balanced-to-buyer conditions. Year-over-year price declines ranging from 3.0% to 6.9% across property types reflect ongoing market adjustments during this transitional phase.
FAQ – Vancouver Real Estate September 2025
Q: Are Vancouver home prices rising or falling in September 2025?
A: Vancouver prices continued easing in September 2025. Year-over-year, Vancouver East houses declined 5.2%, townhouses 3.2%, and condos 5.0%. Vancouver West saw houses drop 6.9%, townhouses 3.0%, and condos 4.1%, reflecting ongoing market adjustments.
Q: Is it a good time to buy Vancouver real estate in September 2025?
A: September 2025 presents favorable buying conditions with buyer-friendly market dynamics. Near-record high inventory levels combined with continued rate cuts provide significant opportunities. Sales-to-active-listings ratios below 15% across most segments indicate strong negotiating power for purchasers.
Q: Which Vancouver area offers better real estate value in September 2025?
A: Vancouver East provides superior value with houses at $1.76M versus Vancouver West’s $3.23M. Additionally, Vancouver East prices stay below Metro Vancouver benchmarks across all property types, offering approximately $176,300 discount on houses and $55,500 on condos compared to regional averages.
Q: How does Vancouver East compare to Vancouver West for real estate investment?
A: Vancouver East shows stronger relative market performance with sales-to-active-listings at 10.3% for houses (above Metro’s 8.5%) and more accessible price points below regional benchmarks. Vancouver West offers luxury positioning with houses at 7.6% ratio, presenting opportunities for high-end purchasers in softening premium market conditions.
Q: What are the best Vancouver communities to buy in September 2025?
A: Both Vancouver East and Vancouver West offer distinct advantages in the current buyer-friendly market. Vancouver East provides exceptional value with below-market pricing and relatively stronger demand indicators, while Vancouver West delivers luxury market opportunities with significant inventory selection and negotiating power for premium purchasers.
Featured Buildings


