Vancouver real estate January 2026 opened the new year continuing last year’s subdued market trends. Subsequently, both Vancouver East and Vancouver West experienced significantly reduced sales activity compared to one year prior. Moreover, the market demonstrated the ongoing adjustment process that characterized the previous year’s historic conditions. As a result, both communities reflected the broader Metro Vancouver pattern of elevated inventory levels paired with cautious buyer sentiment as the region adapts to what may represent a new market equilibrium.
Vancouver East Real Estate January 2026 – Cautious Start Amid Price Adjustments
Vancouver East real estate market began 2026 with continued price softening and subdued transaction volumes. Therefore, this created balanced to buyer-favorable conditions across most property segments as the market continued its adjustment phase.
Vancouver East Housing Market Price Analysis:
Vancouver East Detached Homes / Houses:
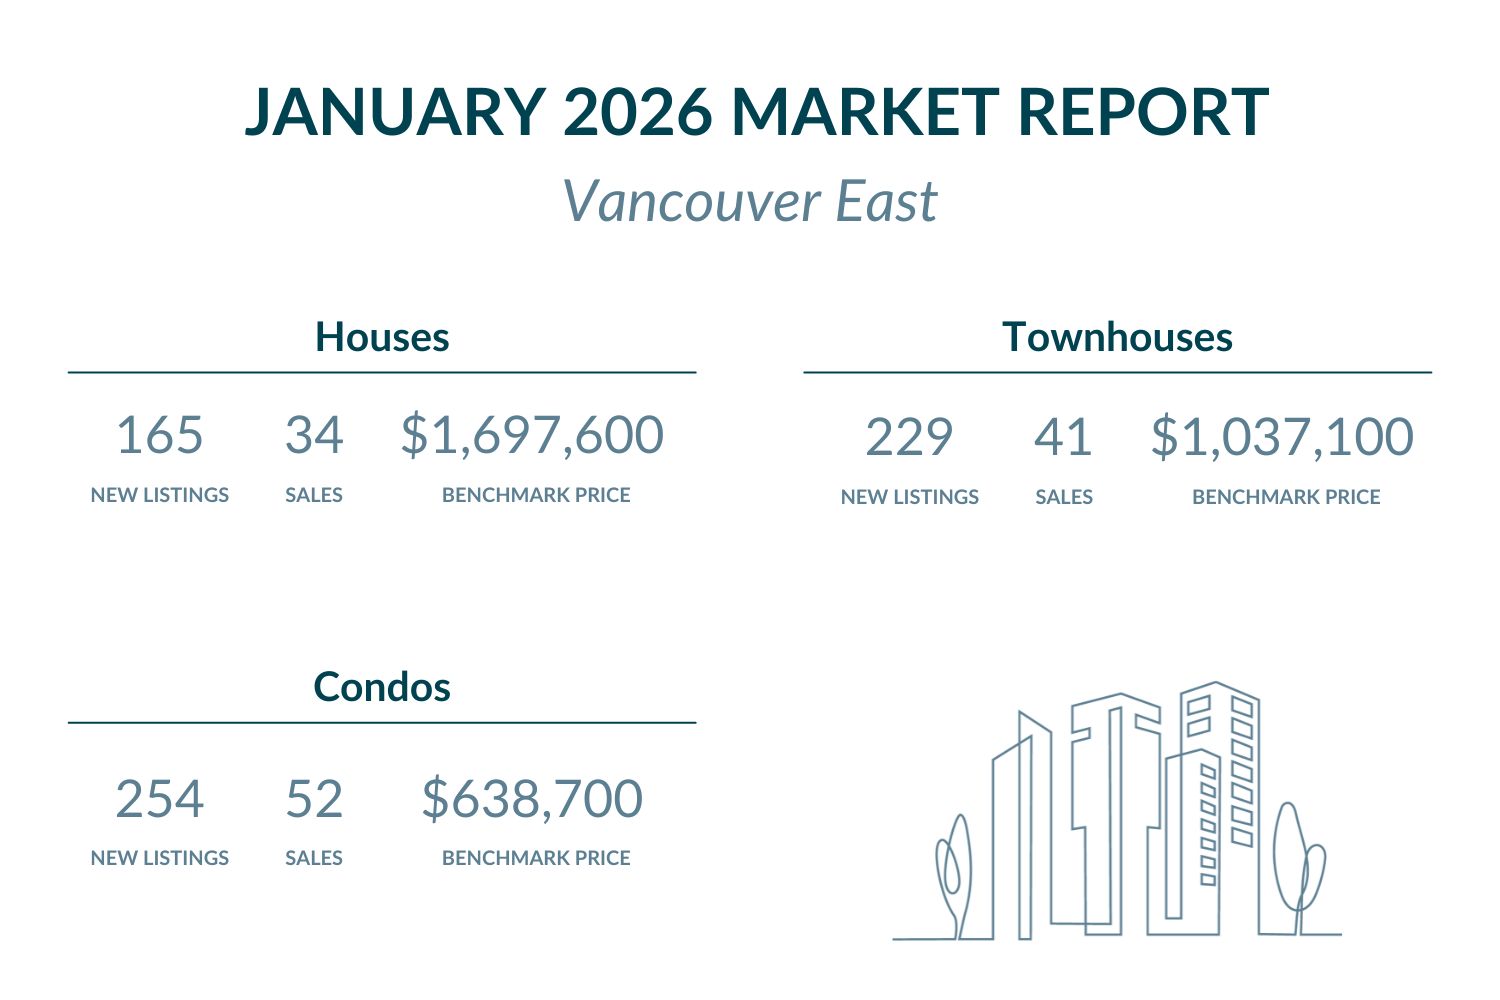
The benchmark price declined 1.2% month-over-month to $1,697,600. Furthermore, this represents a significant 8.1% decrease compared to January 2025. Currently, Vancouver East remains below Metro Vancouver’s benchmark of $1,850,800. Specifically, this provides approximately $153,200 discount from regional averages.
Browse Vancouver East detached homes under $1,700,000 here, or explore available options above $1,700,000.
Vancouver East Townhouses / Attached Homes:
Townhouse prices increased modestly by 0.2% from December to $1,037,100. However, year-over-year prices dropped 7.9% from January 2025. Currently, Vancouver East stays marginally below Metro Vancouver’s benchmark of $1,043,400. As a result, this represents approximately $6,300 discount from regional standards.
Explore Vancouver East townhomes listed below $1,040,000 here, or check out exclusive properties above $1,040,000.
Vancouver East Condos / Apartments:
Condo prices declined 1.7% from December to $638,700. Additionally, prices fell 8.3% compared to January 2025. Currently, Vancouver East stays below Metro Vancouver’s benchmark of $704,600. Moreover, this provides approximately $65,900 value advantage over regional averages.
Search Vancouver East condos priced below $640,000 here, or view high-end listings above $640,000.
Vancouver East Real Estate Market Activity:
New listings showed mixed year-over-year results across property types. Detached home listings reached 165 in January, up from December’s 66. Meanwhile, this represented a modest 3.0% year-over-year increase. Active inventory stood at 468 detached homes. Townhouse listings totaled 229, up from December’s 73. Nevertheless, this marked a solid 5.2% increase year-over-year. Condo listings reached 254, up from December’s 75, showing a 4.3% year-over-year decline. Active inventory for townhouses and condos combined stood at 544 units.
Sales activity showed subdued demand reflecting the new year’s cautious start. Detached home sales totaled 34 with a 20.6% sales-to-new-listings ratio, indicating balanced market conditions with slight buyer advantage. Additionally, the sales-to-active-listings ratio reached 7.3%, slightly exceeding Metro Vancouver’s 6.7% baseline. Townhouse sales reached 41, producing a 17.9% sales-to-new-listings ratio, reflecting buyer’s market conditions with limited urgency. Condo sales totaled 52, yielding a 20.5% sales-to-new-listings ratio, suggesting balanced conditions with modest buyer advantage. Furthermore, the combined sales-to-active-listings ratio for townhouses and condos achieved 11.6%, slightly exceeding Metro Vancouver’s townhouse baseline of 11.1% and exceeding the condo baseline of 10.3%. These ratios demonstrate the ongoing market adjustment as Vancouver East navigates the continued softness characterizing the new year’s opening month, with activity levels reflecting the cautious sentiment prevailing across Metro Vancouver.
- Browse all Vancouver East detached homes with upcoming open houses here.
- Explore Vancouver East townhouses hosting open houses here.
- View all Vancouver East condos with open houses coming up here.

Vancouver West Real Estate January 2026 – Premium Market Experiences Pronounced Adjustment
Vancouver West real estate market began 2026 with significant price corrections and substantially reduced transaction activity. Consequently, this created pronounced buyer-favorable conditions particularly across the luxury segments as the market continued adjusting to the new normal.
Vancouver West Housing Market Price Analysis:
Vancouver West Detached Homes / Houses:
The benchmark price declined sharply by 5.8% month-over-month to $2,956,400. Furthermore, year-over-year prices decreased substantially by 12.2% from January 2025. Currently, Vancouver West dramatically exceeds Metro Vancouver’s benchmark of $1,850,800. Moreover, this commands a substantial premium of approximately $1,105,600.
Browse Vancouver West detached homes listed under $2,960,000 here, or explore upscale house options above $2,960,000.
Vancouver West Townhouses / Attached Homes:
Townhouse prices declined 1.1% from December to $1,397,300. Similarly, year-over-year prices dropped 5.2% from January 2025. Specifically, Vancouver West substantially exceeds Metro Vancouver’s benchmark of $1,043,400. As a result, this commands approximately $353,900 premium above regional standards.
Check out Vancouver West townhouses available under $1,400,000 here, or explore luxury properties exceeding $1,400,000.
Vancouver West Condos / Apartments:
Condo prices decreased modestly by 0.7% from December to $777,200. Additionally, year-over-year prices fell 4.3% from January 2025. Currently, Vancouver West remains above Metro Vancouver’s benchmark of $704,600. Therefore, this represents approximately $72,600 premium over regional averages.
View Vancouver West condos listed below $780,000 here, or check out high-end selections above $780,000.
Vancouver West Real Estate Market Activity:
New listings displayed dramatically varied year-over-year trends across property segments. Detached home new listings reached 189, up from December’s 53. Meanwhile, this marked a modest 3.2% increase year-over-year. Active inventory stood at 556 detached homes. Townhouse new listings totaled 184, up from December’s 57. Nevertheless, this reflected a 2.2% year-over-year decline. Condo new listings reached 543, up from December’s 206, representing a dramatic 45.3% decline year-over-year. Active inventory for condos and townhouses combined stood at 716 units, with Downtown Vancouver specifically showing 822 active condo and townhouse listings.
Sales activity showed substantially subdued market dynamics across all property types. Detached home sales totaled 29 with a 15.3% sales-to-new-listings ratio, indicating buyer’s market conditions with significant negotiating leverage. Additionally, the sales-to-active-listings ratio reached 5.2%, falling notably below Metro Vancouver’s 6.7% baseline. Townhouse sales reached 36, producing a 19.6% sales-to-new-listings ratio, reflecting balanced market conditions with slight buyer advantage. Condo sales totaled 125, yielding a 23.0% sales-to-new-listings ratio, suggesting balanced conditions leaning slightly toward buyers. Furthermore, the combined sales-to-active-listings ratio for condos and townhouses achieved 10.3%, essentially matching Metro Vancouver’s condo baseline of 10.3% while falling slightly below the townhouse baseline of 11.1%. Downtown Vancouver specifically recorded an 8.8% combined ratio, indicating softer absorption in the core. These ratios demonstrate pronounced buyer-favorable conditions particularly in Vancouver West’s detached segment, where absorption fell meaningfully below regional averages, reflecting the continued caution characterizing luxury market segments as the new year commenced.
- Discover Vancouver West detached homes with upcoming open houses here.
- Find all Vancouver West townhouses hosting open houses here.
- Check out Vancouver West condos with open houses coming up here.
Metro Vancouver Market Context – New Year Maintains 2025’s Cautious Momentum
January 2026 confirmed that last year’s market trends continued into the new year as Metro Vancouver began 2026 with subdued transaction activity. According to Greater Vancouver REALTORS®, Andrew Lis noted: “On their own, the January sales appear alarming, but it’s important to put these figures in the context of the past few years. Last year ended with one of the lowest sales totals in over two decades, and so it’s not surprising that the January sales figures were fourth slowest in over two decades as well.”
Furthermore, Lis observed: “Market momentum is a slowly evolving force, and in many ways, the January figures represent a market that continues slowly evolving to what may be a new normal.” He added: “Our recent 2026 forecast suggests this year is likely to resemble 2025 on many fronts, and we expect sales to remain tepid. When paired with sellers remaining eager to list, inventory will likely remain elevated relative to historical averages and, as a result, we expect prices to finish the year relatively unchanged.”
Regarding future market potential, Lis commented: “As consumers adjust to the ongoing backdrop of political and economic uncertainty, we expect a degree of pent-up demand to re-enter the market at some point. Whether it will happen in 2026 remains an open question, and we’ll be watching the market closely for signs of improvement.”
Metro Vancouver’s sales-to-active-listings ratios stood at 6.7% for detached homes, 11.1% for townhouses, and 10.3% for condos. Vancouver East demonstrated slightly stronger performance compared to these benchmarks, with houses achieving 7.3% (exceeding Metro’s 6.7% baseline by 0.6 percentage points), and combined townhouses and condos reaching 11.6% (exceeding both Metro’s townhouse baseline of 11.1% and condo baseline of 10.3%). This modest outperformance suggests relatively more balanced absorption dynamics in Vancouver East.
Meanwhile, Vancouver West recorded notably weaker results with houses at 5.2% (falling 1.5 percentage points below Metro’s 6.7% baseline), and combined condos and townhouses at 10.3% (essentially matching Metro’s condo baseline while falling below the townhouse baseline). Downtown Vancouver specifically recorded 8.8%, indicating pronounced softness in the urban core. The contrast between Vancouver East’s modest resilience (7.3% houses, 11.6% combined multi-family) and Vancouver West’s pronounced weakness (5.2% houses, 10.3% combined) highlights the divergent dynamics within Vancouver’s submarkets.
Therefore, both Vancouver communities began 2026 reflecting the broader adjustment characterizing Metro Vancouver’s evolution toward a new market equilibrium. Vancouver East’s slightly stronger absorption metrics suggest more balanced fundamentals, while Vancouver West’s weaker performance, particularly in the detached segment, underscores the ongoing adjustment pressures facing luxury markets amid elevated inventory levels and persistent buyer caution as the region navigates political and economic uncertainty.
FAQ – Vancouver Real Estate January 2026
Q: Are Vancouver home prices rising or falling in February 2026?
A: Vancouver prices continued declining through January 2026. Vancouver East houses fell 1.2% monthly and 8.1% annually, townhouses rose modestly 0.2% monthly but declined 7.9% annually, while condos dropped 1.7% monthly and 8.3% annually. Vancouver West experienced sharper corrections with houses falling 5.8% monthly and 12.2% annually, townhouses declining 1.1% monthly and 5.2% annually, and condos dropping 0.7% monthly and 4.3% annually.
Q: Is it a good time to buy Vancouver real estate in February 2026?
A: February 2026 presents buyer-favorable conditions following January’s cautious market start. Vancouver East shows sales-to-active-listings ratios of 7.3% for houses and 11.6% combined for townhouses and condos, slightly exceeding Metro baselines. Vancouver West demonstrates pronounced buyer opportunities with houses at 5.2% (below Metro’s 6.7%) and combined condos/townhouses at 10.3%. Elevated inventory levels, continued price adjustments, and subdued competition create advantageous negotiating conditions as the market adjusts to its new normal.
Q: Which Vancouver area offers better real estate value in February 2026?
A: Vancouver East provides superior value with houses at $1.7M versus Vancouver West’s $3.0M. Additionally, Vancouver East prices stay below Metro Vancouver benchmarks across all property types while demonstrating slightly stronger absorption (7.3% houses, 11.6% combined multi-family versus Metro’s 6.7%, 11.1%, and 10.3% respectively), suggesting more balanced market fundamentals amid the broader adjustment.
Q: How does Vancouver East compare to Vancouver West for real estate investment in February 2026?
A: Vancouver East shows better relative positioning with below-Metro pricing and slightly stronger absorption exceeding Metro baselines across segments (7.3% houses versus Metro’s 6.7%, 11.6% combined multi-family versus Metro’s 11.1%-10.3%). Vancouver West offers luxury positioning but faces pronounced adjustment pressures with houses at 5.2% absorption (below Metro’s 6.7%), providing significant negotiating opportunities for buyers willing to navigate the premium market’s ongoing recalibration to new normal conditions.
Q: What are the best Vancouver communities to buy in February 2026?
A: Both Vancouver East and Vancouver West offer distinct opportunities as 2026 begins. Vancouver East provides exceptional value with below-Metro pricing and relatively stronger fundamentals amid the market adjustment. Vancouver West delivers premium positioning with pronounced buyer leverage, particularly in detached homes where absorption fell meaningfully below Metro baselines. Buyers benefit from elevated inventory levels, continued price adjustments, and reduced competition as the market slowly evolves toward equilibrium conditions expected to persist throughout 2026.
Other Presales, Condos, Townhomes Updates
Featured Buildings


