Vancouver Real Estate February 2026 | Vancouver East & Vancouver West Market
Written by Lynn Le Drew
Vancouver real estate February 2026 confirmed the continuation of the new normal as subdued sales activity persisted across the region. Subsequently, both Vancouver East and Vancouver West demonstrated mixed market dynamics with elevated inventory levels. Moreover, new listings declined year-over-year as sellers showed less eagerness to enter the market. As a result, both communities maintained buyer-favorable conditions with varied absorption patterns across property types.
Vancouver East Real Estate February 2026 – Mixed Recovery with Strong Multi-Family Activity
Vancouver East real estate market showed selective strength throughout February 2026. Therefore, this created opportunities for buyers across different property segments.
Vancouver East Housing Market Price Analysis:
Vancouver East Detached Homes / Houses:
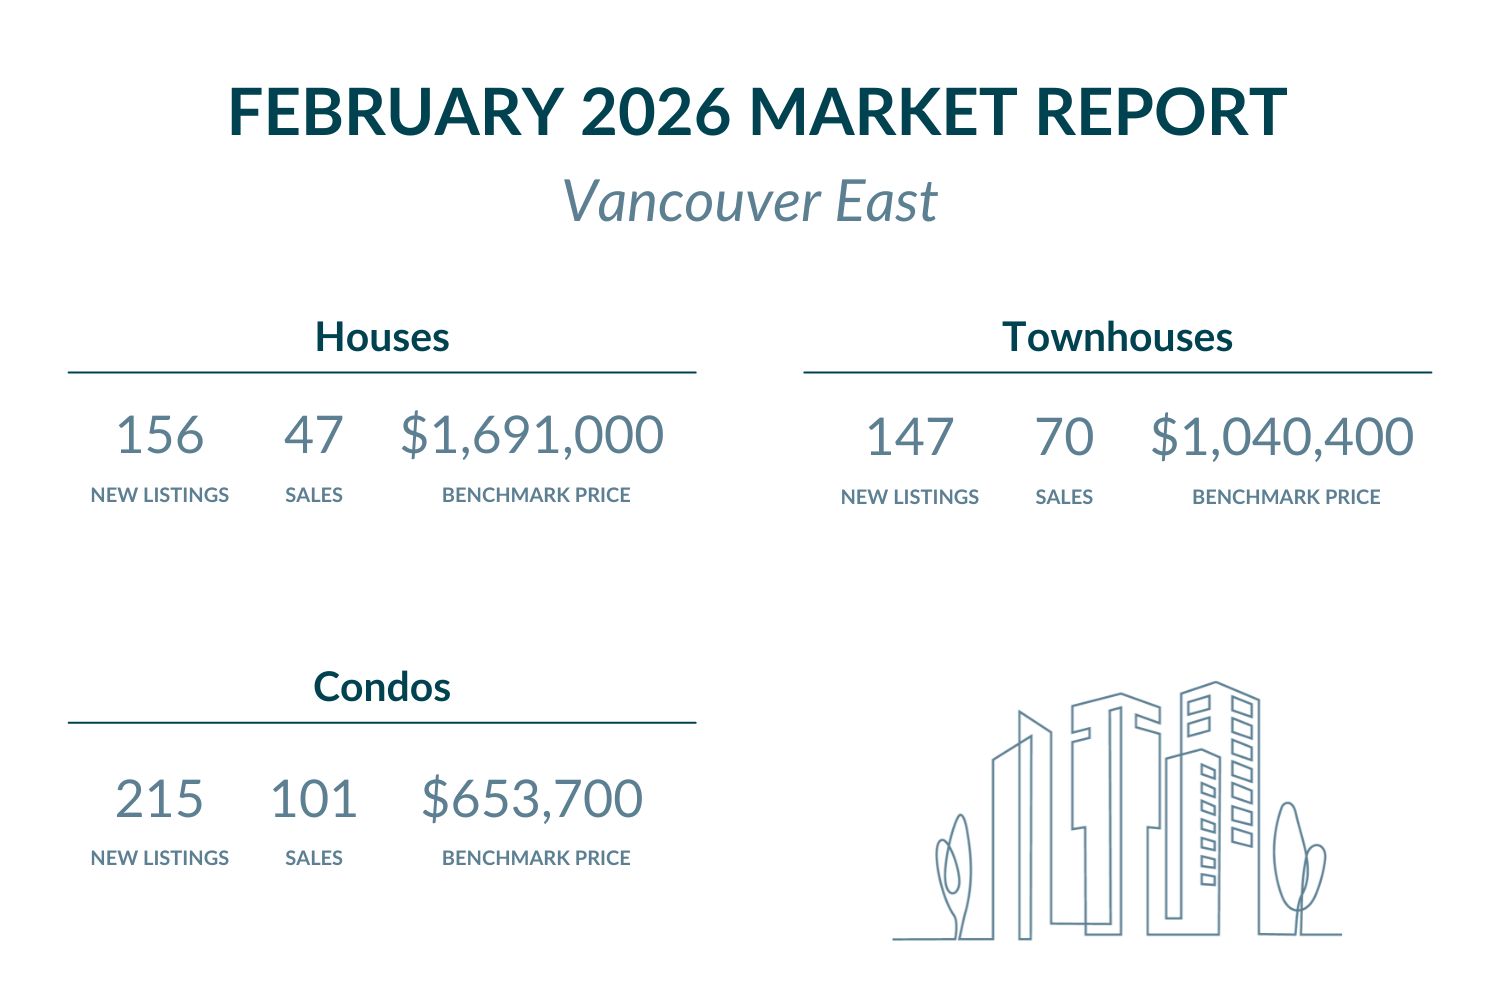
The benchmark price declined modestly by 0.4% month-over-month to $1,691,000. Furthermore, this represents a 9.4% decrease compared to February 2025. Currently, Vancouver East remains below Metro Vancouver’s benchmark of $1,835,900. Specifically, this provides approximately $144,900 discount from regional averages.
Browse Vancouver East detached homes under $1,690,000 here, or explore available options above $1,690,000.
Vancouver East Townhouses / Attached Homes:
Townhouse prices increased 0.3% from January to $1,040,400. However, year-over-year prices dropped 9.3% from February 2025. Currently, Vancouver East stays just below Metro Vancouver’s benchmark of $1,046,100. As a result, this represents approximately $5,700 marginal discount from regional standards.
Explore Vancouver East townhomes listed below $1,040,000 here, or check out exclusive properties above $1,040,000.
Vancouver East Condos / Apartments:
Condo prices increased 2.3% from January to $653,700. Additionally, year-over-year prices declined 5.5% compared to February 2025. Currently, Vancouver East stays below Metro Vancouver’s benchmark of $708,200. Moreover, this provides approximately $54,500 value advantage over regional averages.
Search Vancouver East condos priced below $654,000 here, or view high-end listings above $654,000.
Vancouver East Real Estate Market Activity:
New listings showed declining trends across most property types. Detached home listings reached 156 in February, down from January’s 165. Meanwhile, this represented a 9.6% year-over-year decrease. Currently, active inventory stands at 494 detached homes. Townhouse listings totaled 147, down from January’s 229. Nevertheless, this marked a modest 0.7% decline year-over-year. Condo listings reached 215, down from January’s 254, showing a 10.7% year-over-year decline. Active inventory stands at 599 combined townhouses and condos.
Sales activity showed mixed performance across property segments. Detached home sales totaled 47 with a 30.1% sales-to-new-listings ratio, indicating buyer’s market conditions leaning toward balance. Additionally, the sales-to-active-listings ratio reached 9.5%, slightly exceeding Metro Vancouver’s 9.0% baseline. Townhouse sales reached 70, producing a 47.6% sales-to-new-listings ratio, reflecting balanced conditions with moderate seller advantage. Condo sales totaled 101, yielding a 47.0% sales-to-new-listings ratio, suggesting balanced market conditions with slight seller advantage. Furthermore, the combined townhouse and condo sales-to-active-listings ratio achieved 21.0%, significantly exceeding Metro Vancouver’s 16.6% for townhouses and 14.1% for condos. These ratios indicate healthy multi-family demand with particularly strong absorption in Vancouver East.
- Browse all Vancouver East detached homes with upcoming open houses here.
- Explore Vancouver East townhouses hosting open houses here.
- View all Vancouver East condos with open houses coming up here.
Vancouver West Real Estate February 2026 – Premium Market Shows Selective Strength
Vancouver West real estate market demonstrated selective strength throughout February 2026. Consequently, this reflected varied buyer confidence across different property segments.
Vancouver West Housing Market Price Analysis:
Vancouver West Detached Homes / Houses:
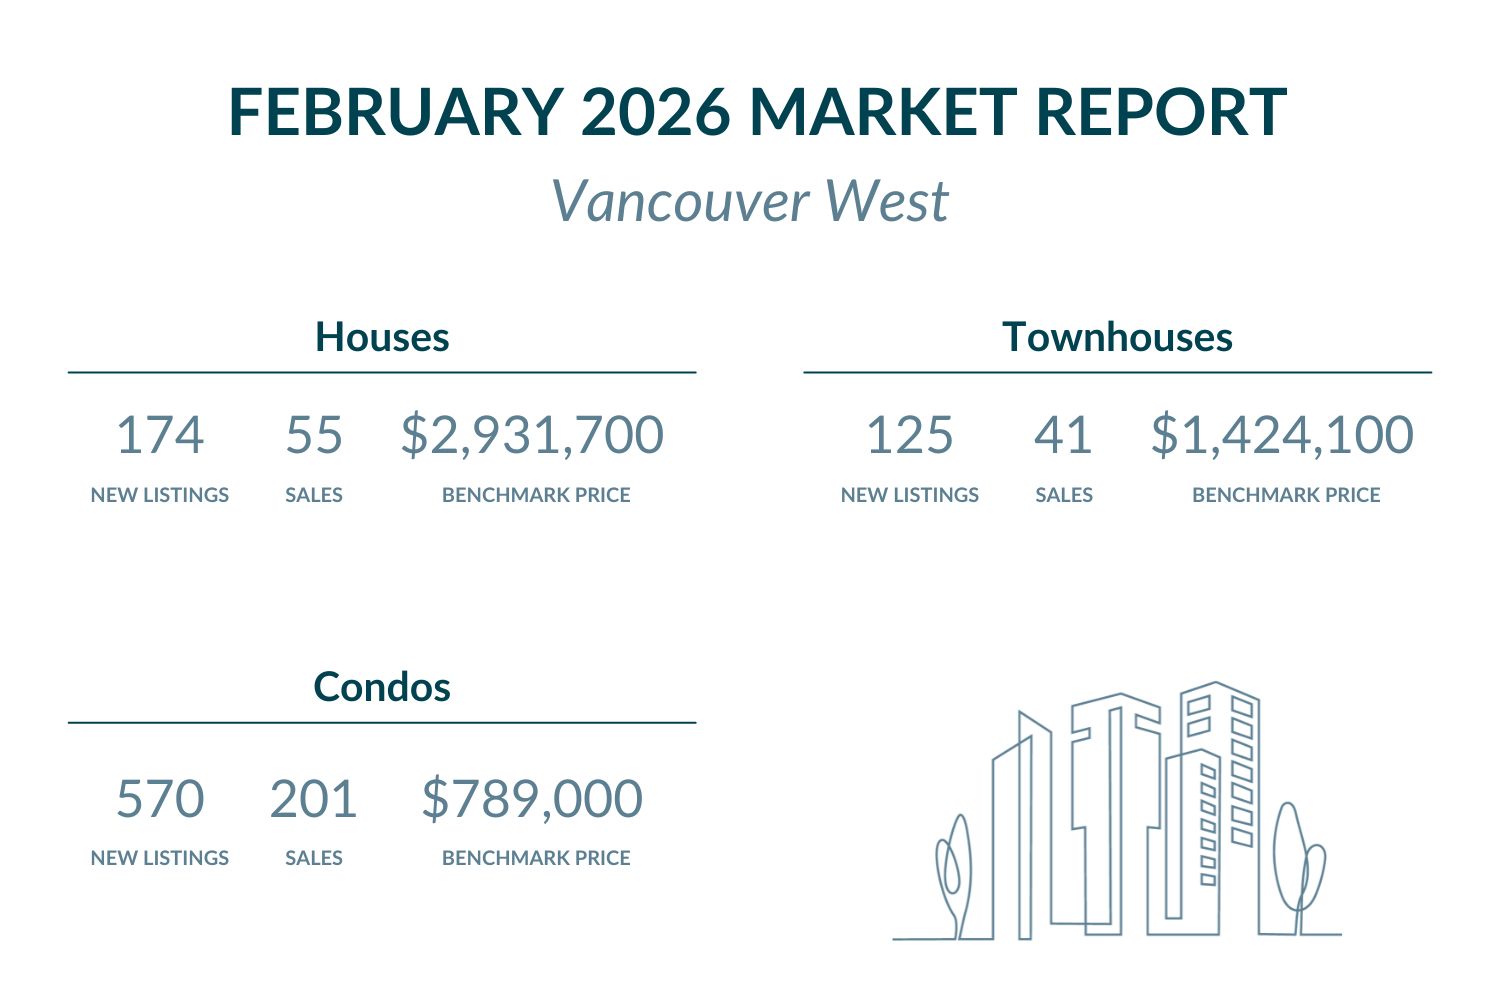
The benchmark price declined 0.8% month-over-month to $2,931,700. However, year-over-year prices decreased 13.7% from February 2025. Currently, Vancouver West dramatically exceeds Metro Vancouver’s benchmark of $1,835,900. Moreover, this commands a substantial premium of approximately $1,095,800.
Browse Vancouver West detached homes listed under $2,930,000 here, or explore upscale options above $2,930,000.
Vancouver West Townhouses / Attached Homes:
Townhouse prices increased 1.9% from January to $1,424,100. Similarly, year-over-year prices dropped 4.2% from February 2025. Specifically, Vancouver West substantially exceeds Metro Vancouver’s benchmark of $1,046,100. As a result, this commands approximately $378,000 premium above regional standards.
Check out Vancouver West townhouses available under $1,425,000 here, or explore luxury properties exceeding $1,425,000.
Vancouver West Condos / Apartments:
Condo prices increased 1.5% from January to $789,000. Additionally, year-over-year prices fell 6.1% from February 2025. Currently, Vancouver West remains above Metro Vancouver’s benchmark of $708,200. Therefore, this represents approximately $80,800 premium over regional averages.
View Vancouver West condos listed below $790,000 here, or check out high-end selections above $790,000.
Vancouver West Real Estate Market Activity:
New listings displayed mixed trends across property segments. House new listings reached 174 from January’s 189. Meanwhile, this marked a modest 1.1% increase year-over-year. Currently, active inventory stands at 597 detached homes. Townhouse new listings totaled 125, down from January’s 184. Nevertheless, this reflected a 12.8% decline year-over-year. Condo new listings reached 570, up from January’s 543, representing a significant 31.8% decline year-over-year. Active inventory for Vancouver West totals 811 combined condos and townhouses, while the Downtown sub-market accounts for an additional 881 units.
Sales activity showed balanced to strong performance across property types. Detached home sales totaled 55 with a 31.6% sales-to-new-listings ratio, indicating buyer’s market conditions leaning toward balance. Additionally, the sales-to-active-listings ratio reached 9.2%, slightly exceeding Metro Vancouver’s 9.0% baseline. Townhouse sales reached 41, producing a 32.8% sales-to-new-listings ratio, reflecting buyer’s market conditions with improving momentum. Condo sales totaled 201, yielding a 35.3% sales-to-new-listings ratio, suggesting buyer’s market conditions. Furthermore, the combined condo and townhouse sales-to-active-listings ratio achieved 13.6%, below Metro Vancouver’s 16.6% for townhouses but slightly below the 14.1% for condos. Additionally, Downtown specifically recorded 13.2% combined ratio. These ratios demonstrate varied market dynamics across property types with selective strength emerging.
- Discover Vancouver West detached homes with upcoming open houses here.
- Find all Vancouver West townhouses hosting open houses here.
- Check out Vancouver West condos with open houses coming up here.
Metro Vancouver Market Context – New Normal Continues Amid Seller Reluctance
February 2026 confirmed the continuation of Metro Vancouver’s new normal with sales running well below long-term averages. According to Greater Vancouver REALTORS®, Andrew Lis noted: “With each passing data point, the pace of sales running well-below long-term averages are no longer a surprise – it’s become the new norm.”
Furthermore, Lis observed a surprising development: “home sellers appear less eager to list their homes relative to last year with new listings down about seven percent, mostly driven by fewer listings in the apartment segment.” Additionally, he noted: “With fewer sellers coming to market with their properties than last year, a pick-up in demand heading into the spring could result in a stagnation of standing inventory, which may support prices around current levels.”
Metro Vancouver’s sales-to-active-listings ratios stood at 9.0% for detached homes, 16.6% for townhouses, and 14.1% for condos. Vancouver East showed stronger absorption compared to these benchmarks, with houses achieving 9.5% (slightly above Metro), and combined multi-family at 21.0% (significantly exceeding Metro’s townhouse 16.6% and condo 14.1%). Meanwhile, Vancouver West recorded mixed results with houses at 9.2% (slightly above Metro), and combined multi-family at 13.6% (below Metro’s townhouse baseline but near condo levels).
The standout performance was Vancouver East multi-family properties, indicating particularly strong demand relative to available inventory. Therefore, both Vancouver communities continue demonstrating the new normal with elevated inventory and varied buyer interest. As Lis concluded: “the spring market will be the litmus test of whether we continue along this new normal, or if we see any significant surprises.”
Frequently Asked Questions – Vancouver Real Estate February 2026
Q: Are Vancouver home prices rising or falling in February 2026?
A: Vancouver prices showed mixed movement in February 2026. Vancouver East houses declined 0.4% monthly while townhouses rose 0.3% and condos increased 2.3%. Vancouver West saw houses drop 0.8% while townhouses climbed 1.9% and condos rose 1.5%, reflecting continued market stabilization.
Q: Is it a good time to buy Vancouver real estate in February 2026?
A: February 2026 presents favorable buying conditions with buyer-favorable dynamics. Vancouver East shows sales-to-active-listings ratios of 9.5% for houses and 21.0% for multi-family, while Vancouver West demonstrates 9.2% to 13.6% ratios. Market conditions favor buyers with enhanced negotiating power, particularly in detached homes.
Q: Which Vancouver area offers better real estate value in February 2026?
A: Vancouver East provides superior value with houses at $1.7M versus Vancouver West’s $2.9M. Additionally, Vancouver East shows exceptional multi-family absorption at 21.0% sales-to-active-listings ratio, significantly exceeding Metro Vancouver’s 16.6% townhouse and 14.1% condo benchmarks.
Q: How does Vancouver East compare to Vancouver West for real estate investment?
A: Vancouver East shows exceptional multi-family performance with 21.0% combined sales-to-active-listings ratio, significantly exceeding Metro Vancouver averages. Vancouver West offers premium market positioning with selective strength emerging, particularly in detached homes matching Metro absorption levels at 9.2%.
Q: What are the best Vancouver communities to buy in February 2026?
A: Both Vancouver East and Vancouver West offer distinct advantages. Vancouver East provides exceptional value with below-market pricing and outstanding multi-family fundamentals, while Vancouver West delivers premium market opportunities with stabilizing prices and improving buyer confidence across segments.
Other Presales, Condos, Townhomes Updates
Featured Buildings


