
The North Shore real estate market in November 2024 presented a mixed picture, with stability in some segments and challenges in others.
North Vancouver: Prices Show Stability Across Most Property Types, While New Listings Drop and Sales Ratios Remain Robust.
Price Analysis:
House/Detached:
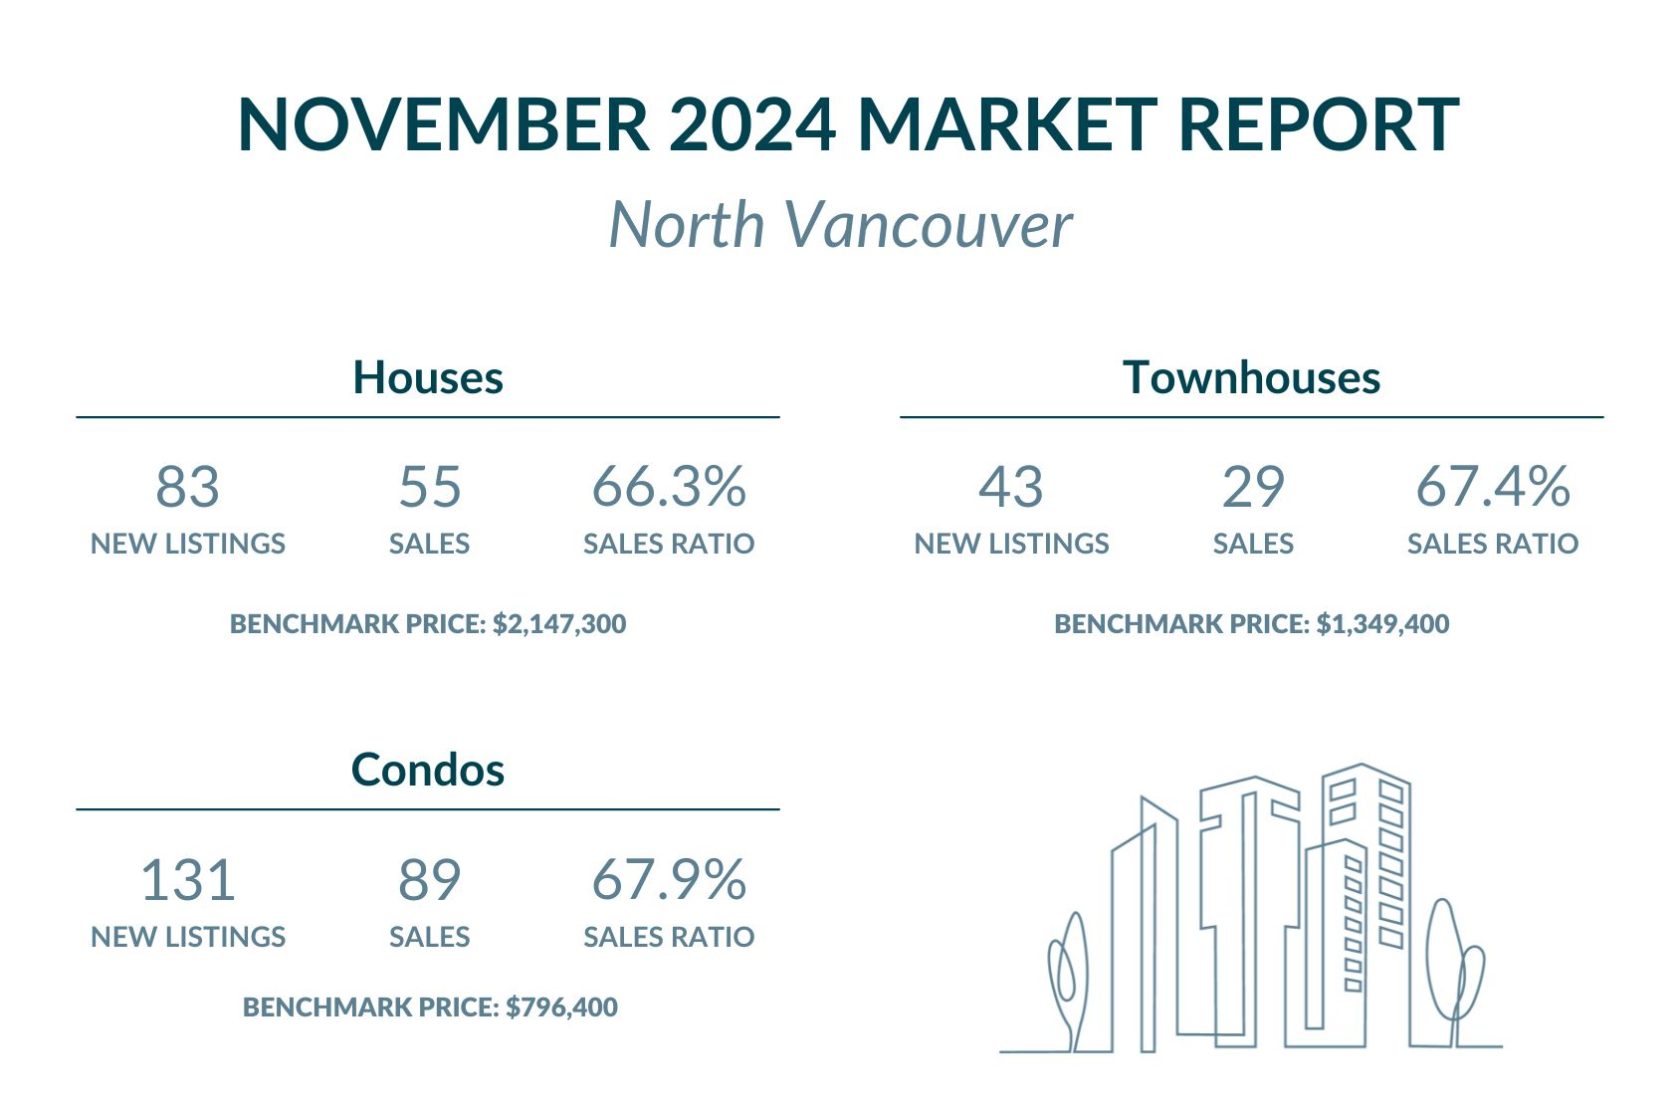
The benchmark price for detached homes in North Vancouver rose to $2,147,300, a slight 0.5% month-over-month increase but a 1.5% decline year-over-year. This remains significantly higher than Metro Vancouver’s benchmark of $1,997,400.
Check out North Vancouver houses under $2,150,000 here, or find those priced over $2,150,000 here.
Townhouse/Attached:
Townhouse prices fell to $1,349,400, down 1.1% month-over-month but up 0.4% year-over-year, surpassing Metro Vancouver’s $1,117,600 benchmark.
Explore North Vancouver townhomes under $1,350,000 here, and discover townhouses priced over $1,350,000 here.
Condo/Apartment:
At $796,400, the benchmark price for North Vancouver condos is above Metro Vancouver’s $752,800, reflecting a 0.7% monthly increase and a 0.1% annual decline.
Browse North Vancouver condos under $800,000 here and view apartments over $800,000 here.
New Listings and Sales:
In November, inventory remained stable compared to last year, with slight declines in townhouses and condos. Detached houses in North Vancouver saw 83 new listings, which was unchanged from November 2023 but down from 158 in October. North Vancouver’s Townhouse listings dropped to 43 from 85, reflecting a 14.0% year-over-year decrease. Meanwhile, condo listings in North Vancouver fell to 131 from October’s 228, remaining nearly unchanged compared to last year.
Sales ratios in North Vancouver remained strong across all property types. Detached homes saw 55 sales, maintaining a 66.3% sales ratio, consistent with the previous year and significantly higher than Metro Vancouver’s 12.7%. Townhouses had 29 sales, achieving a 67.4% sales ratio, nearly triple Metro Vancouver’s 23.1%, and slightly up by 0.1% year-over-year. Condos performed particularly well, with 89 units sold and a 67.9% sales ratio, marking a significant 35.9% increase from last year, and far exceeding Metro Vancouver’s 18.7%. Take a look at all the condos in North Vancouver with an open house coming up here.
West Vancouver – Different Trends in Year-over-Year Property Prices, New Listings Drop, and Sales Ratios Rise Across All Property Types
Price Analysis:
House/Detached:
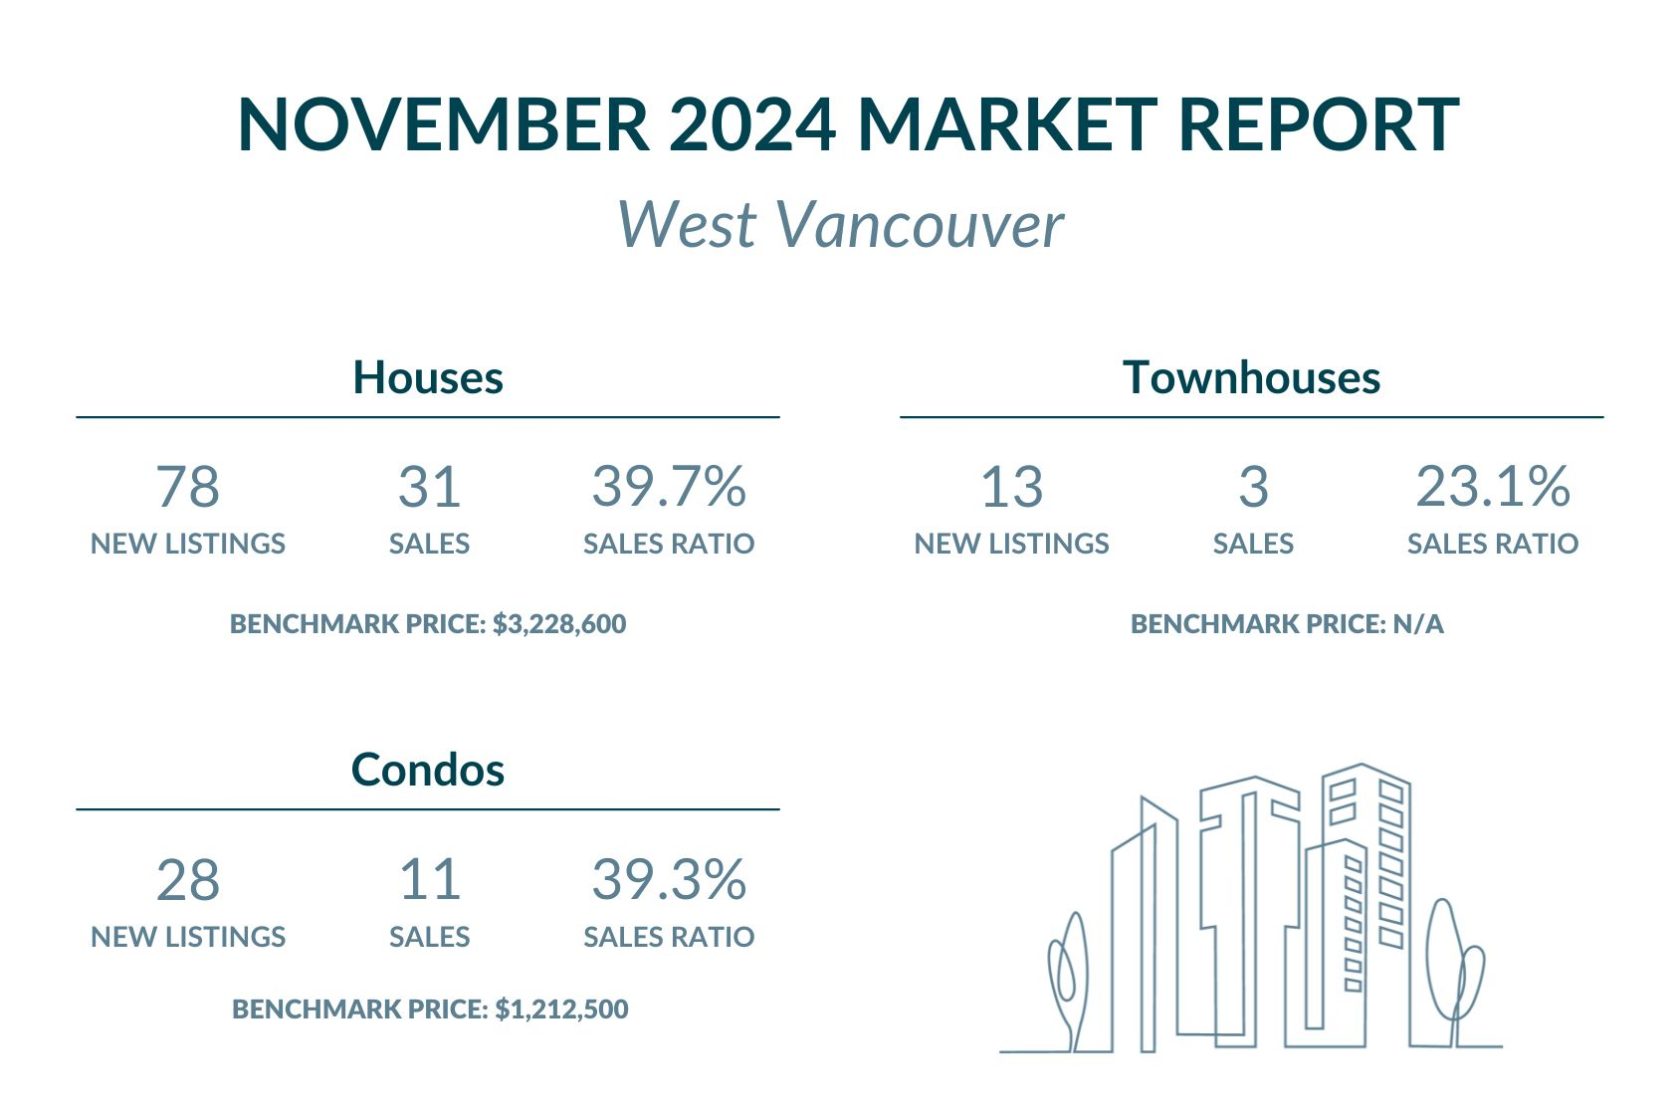
West Vancouver’s benchmark price for detached homes reached $3,228,600, up 0.1% month-over-month and 1.3% year-over-year, nearly double Metro Vancouver’s $1,997,400.
Explore West Vancouver homes under $3,250,000 right here, or uncover options priced over $3,250,000 here.
Condo/Apartment:
At $1,212,500, condo prices in West Vancouver dropped 2.3% from October and 3.1% annually, maintaining their premium over Metro Vancouver’s $752,800.
See West Vancouver condos under $1,200,000 here, and uncover prices over $1,200,000 here.
New Listings and Sales:
November experienced significant declines in detached home and condo listings year-over-year. Detached home listings in West Vancouver dropped to 78, down 24.4% from November 2023, and decreased from 145 in October. West Vancouver’s Condo listings also saw a notable decline, falling to 28 from 52 in October, marking a 7.1% year-over-year decrease. This contrasts with Metro Vancouver, which saw broader condo inventory growth. On the other hand, townhouse listings in West Vancouver rose to 13, up from 11 in October, representing a 46.2% year-over-year increase.
Sales activity in West Vancouver remained strong across property types. Detached homes saw 31 sales, achieving a 39.7% sales ratio, significantly higher than Metro Vancouver’s 12.7%. Townhouse sales, however, fell to just 3 units, yielding a 23.1% sales ratio, which was in line with Metro Vancouver’s townhouse sales ratio. Condos performed well, with 11 units sold and a 39.3% sales ratio, more than double Metro Vancouver’s 18.7% for apartment sales. Take a look at all the condos in West Vancouver with an open house coming up here.
Home buyer demand continues to strengthen in November, inventorying decreased but sales ratios rose.
Residential sales in Metro Vancouver saw a 28% year-over-year increase, continuing the strong momentum from October. Despite this surge in activity, the benchmark price for all residential properties in the region experienced a slight dip compared to last year.
Currently, sales ratios in Metro Vancouver average 12.7% for detached homes, 23.1% for townhomes, and 18.7% for condos. In North Vancouver, homebuyer demand remained strong in November 2024, mirroring the broader regional trend. In contrast, West Vancouver showed some divergence, with different trends emerging in certain property types.
Featured Buildings


