May 2024 saw a dynamic real estate market in the North Shore, with notable differences in performance between North Vancouver and West Vancouver. Here, we delve into the key statistics and trends shaping the market in these regions.
North Vancouver – Mixed price trends & significant new listing increase
Price Analysis:
House/Detached:
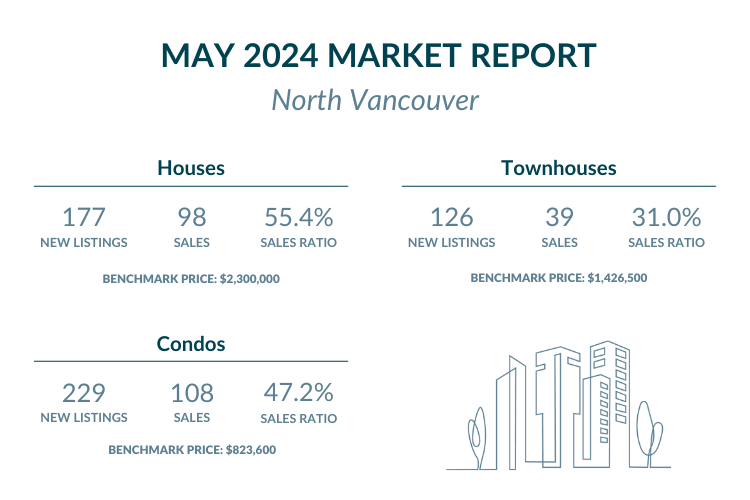
The benchmark price for houses in North Vancouver increased by 1.9% from April 2024, reaching $2,300,000. On a year-over-year basis, house prices rose by 2.9%, reflecting steady growth.
Check out North Vancouver houses under $2,300,000 or priced over $2,300,000 here.
Townhouse/Attached:
Townhouse prices saw a significant monthly increase of 2.8%, bringing the benchmark price to $1,426,500. Over the past year, townhouse prices have surged by 10.0%, indicating a strong demand in this segment.
Browse North Vancouver townhomes under $1,426,500 here, or priced over $1,426,500 here.
Condo/Apartments:
The benchmark price for condos remained virtually unchanged at $823,600 from April 2024. Year-over-year, condo prices increased by 3.7%, showing consistent appreciation.
Explore condos for under $823,600 in North Vancouver here and over $823,600 here.
New Listings and Sales:
In North Vancouver, the real estate market saw a mix of changes in May 2024. There were 177 new house listings, a slight increase of 0.6% compared to May 2023, but a decrease from the 231 new listings in April 2024. This indicates a fluctuating market for houses. Meanwhile, new townhouse listings in North Vancouver surged to 126, a significant year-over-year increase of 48.4% from 65 in May 2023, highlighting a strong interest in townhouses. Similarly, condo new listings rose to 229, reflecting a 16.2% increase compared to May 2023, although this was a slight drop from the 254 new listings in April 2024.
Despite the rise in new listings, sales performance varied. House sales in May 2024 totalled 98, with a sales ratio of 55.4%, representing a decline of 8.1% compared to the same month last year. This suggests a cooling in house demand despite more listings. Townhouse sales were 39, resulting in a sales ratio of 31.0%, a sharp decrease of 61.3% from May 2023, indicating a significant imbalance between supply and demand. Condo sales reached 108, with a sales ratio of 47.2%, marking a significant decline of 28.7% from May 2023. This trend shows that while there are more listings, the market is facing challenges in maintaining high sales ratios.
West Vancouver – Mixed trends in new listing and sales ratios.
Price Analysis:
House/Detached:
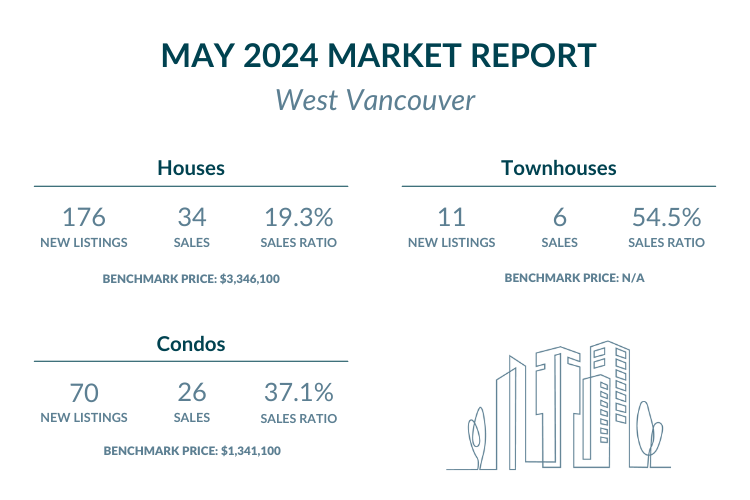
The benchmark price for houses in West Vancouver increased by 3.1% from April 2024, reaching $3,346,100. On a year-over-year basis, house prices rose by 7.9%, indicating strong market demand.
View West Vancouver houses under $3,346,100 here or priced over $3,346,100 here.
Condo/Apartments:
Condo prices experienced a slight monthly increase of 0.5%, with the benchmark price at $1,341,100. Over the past year, condo prices increased by 2.3%, showing moderate growth.
Find West Vancouver condos under $1,341,100 here, and priced over $1,341,100 here.
New Listings and Sales:
In West Vancouver, the real estate market exhibited diverse trends in May 2024. There were 176 new house listings, a 4.0% increase compared to May 2023, though this figure was down from 214 in April 2024. This suggests a slight uptick in house listings year-over-year but a notable drop from the previous month. In contrast, new townhouse listings in West Vancouver saw a sharp decline of 54.5% year-over-year, with only 11 new listings in May 2024, down from 17 in May 2023 and 15 in April 2024. This highlights a significant reduction in townhouse availability. On the other hand, condo new listings totalled 70 in May 2024, reflecting a substantial increase of 41.4% compared to May 2023 and up from 58 in April 2024, indicating growing interest in the condo market.
Sales figures revealed contrasting patterns. House sales in May 2024 totalled 34, resulting in a sales ratio of 19.3%, which represents a decline of 20.4% compared to May 2023. This indicates weakening demand for houses despite the increase in listings. Townhouse sales, however, totaled 6, with a sales ratio of 54.5%, marking a notable increase of 15.9% from May 2023, suggesting stronger demand relative to the limited supply. Condo sales reached 26 in May 2024, with a sales ratio of 37.1%, but this marks a significant decline of 47.5% from May 2023, pointing to a considerable drop in condo demand despite the rise in new listings. These trends underscore a dynamic market with varying demand across different property types.
Conclusion
The North Shore real estate market in May 2024 showcases varied trends across North Vancouver and West Vancouver. North Vancouver displays steady price growth and increased new listings, especially in the townhouse segment, despite a notable decline in sales ratios. In West Vancouver, house prices have seen robust growth, while new listings for townhouses have declined sharply. Both regions show a decrease in condo sales ratios, suggesting a shift in buyer behaviour or market conditions. As we continue through 2024, these trends will be critical to monitor for their long-term impact on the North Shore real estate landscape.
Featured Buildings


