North Shore Real Estate September 2025 | North Vancouver & West Vancouver Market
Written by Colin Gatward
North Shore real estate September 2025 confirmed the ongoing market adjustment as easing prices and rising inventory created buyer-friendly conditions across the region. Subsequently, both North Vancouver and West Vancouver demonstrated varied performance across property segments. Moreover, sales activity remained modest relative to available inventory levels. As a result, both communities reflected the broader Metro Vancouver shift toward balanced-to-buyer market conditions.
North Vancouver Real Estate September 2025 – Balanced Conditions with Strong Condo Activity
North Vancouver real estate market showed balanced performance throughout September 2025. Therefore, this created diverse opportunities depending on property type and buyer preferences.
North Vancouver Housing Market Price Analysis:
North Vancouver Detached Homes / Houses:
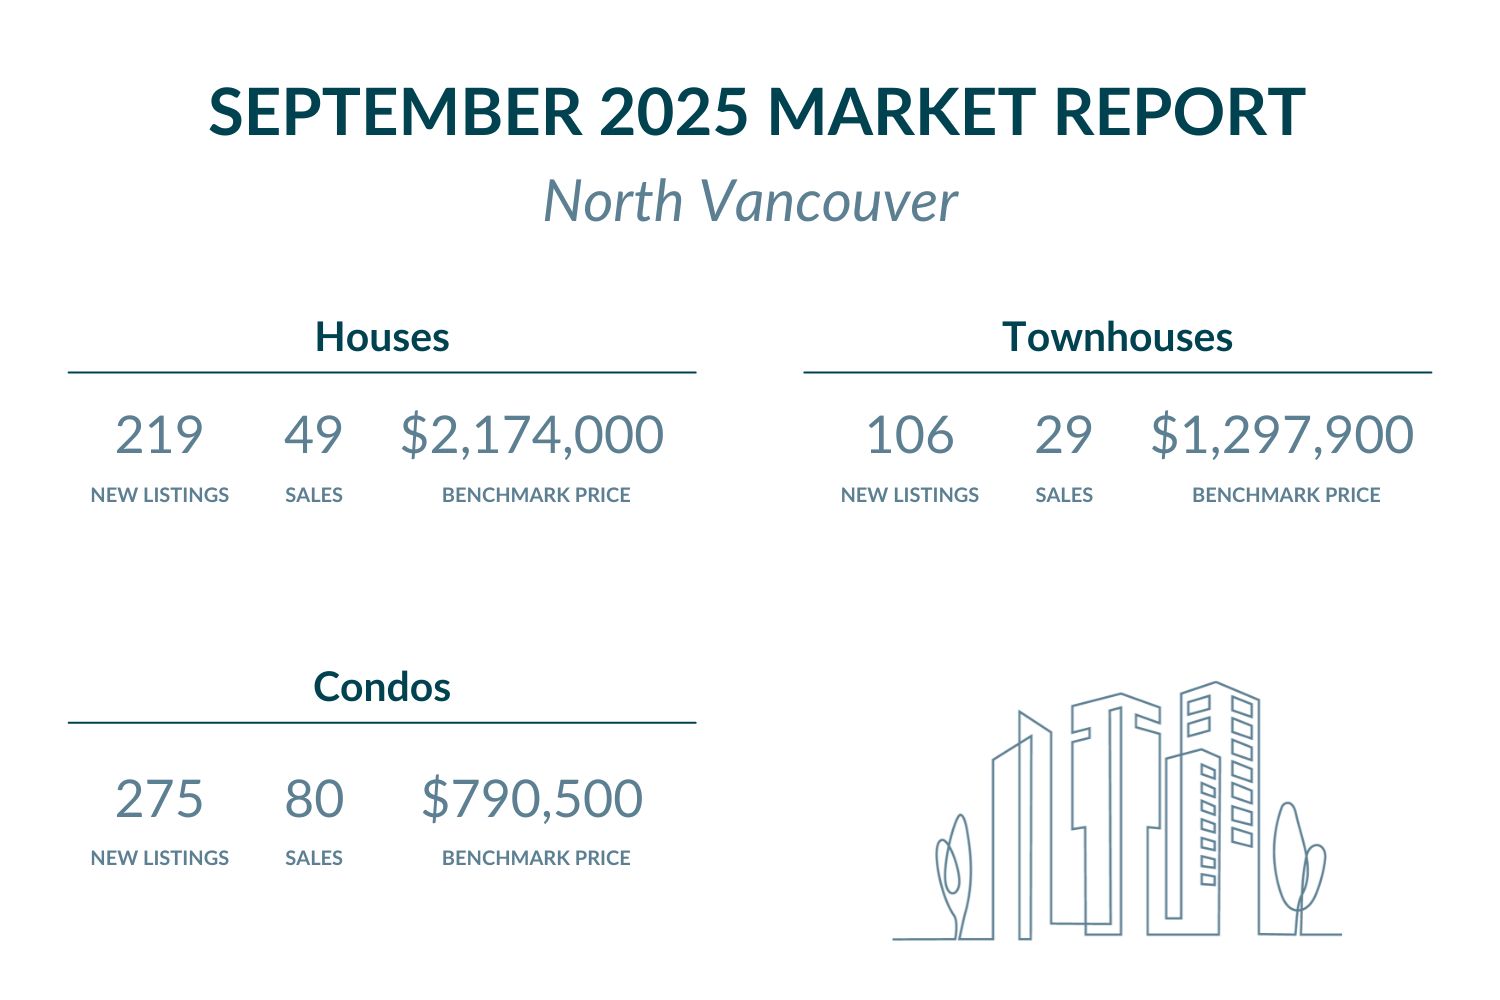
The benchmark price for houses declined modestly by 0.1% month-over-month to $2,172,000. However, year-over-year prices decreased 1.7% compared to September 2024. Currently, North Vancouver exceeds Metro Vancouver’s benchmark of $1,933,100. Specifically, this commands approximately $238,900 premium above regional averages.
Browse North Vancouver houses under $2,175,000 here, or explore available options above $2,175,000.
North Vancouver Townhouses / Attached Homes:
The benchmark price for townhouses increased 0.9% from August to $1,297,900. Additionally, year-over-year prices rose 2.2% from September 2024. Currently, North Vancouver substantially exceeds Metro Vancouver’s benchmark of $1,069,800. As a result, this commands approximately $228,100 premium above regional standards.
Explore North Vancouver townhomes listed below $1,300,000 here, or check out exclusive properties above $1,300,000.
North Vancouver Condos / Apartments:
The benchmark price for condos declined 0.5% from August to $790,500. Moreover, year-over-year prices fell 0.9% compared to September 2024. Currently, North Vancouver remains above Metro Vancouver’s benchmark of $728,800. Therefore, this represents approximately $61,700 premium over regional averages.
Search North Vancouver condos priced below $795,000 here, or view high-end listings above $795,000.
North Vancouver Real Estate Market Activity:
New listings displayed strong growth across all property segments. House new listings increased to 219 in September, up substantially from August’s 100. Furthermore, this marked a strong 18.3% increase year-over-year. Townhome new listings reached 106, up significantly from August’s 58. Nevertheless, this reflected a modest 0.9% increase year-over-year. Condo new listings totaled 275, jumping from August’s 143, showing a 7.3% year-over-year increase. Active inventory in September was 324 for houses, and 526 for attached homes (condos and townhomes).
Sales activity showed balanced conditions across property types. House sales totaled 49 with a 22.4% sales-to-new-listings ratio, indicating buyer’s market conditions. Townhome sales reached 29, producing a 27.4% sales-to-new-listings ratio, reflecting buyer’s market conditions with slight improvement. Condo sales totaled 80, yielding a 29.1% sales-to-new-listings ratio, suggesting buyer’s market conditions approaching balance. Additionally, the sales-to-active-listings ratio for houses reached 12.7%, exceeding Metro Vancouver’s 8.5% baseline. For attached homes combined (condos and townhomes), the sales-to-active-listings ratio achieved 17.3%, outperforming the regional market. These ratios indicate relatively strong demand across all property types, with houses and attached homes both exceeding regional benchmarks.
View all houses with open houses in North Vancouver here, browse townhomes with open houses here, or explore condos with open houses here.
West Vancouver Real Estate September 2025 – Premium Market Shows Significant Adjustments
West Vancouver real estate market maintained its ultra-premium positioning while experiencing notable price adjustments throughout September 2025. Consequently, this created opportunities in the luxury segment for well-positioned buyers.
West Vancouver Housing Market Price Analysis:
West Vancouver Detached Homes / Houses:
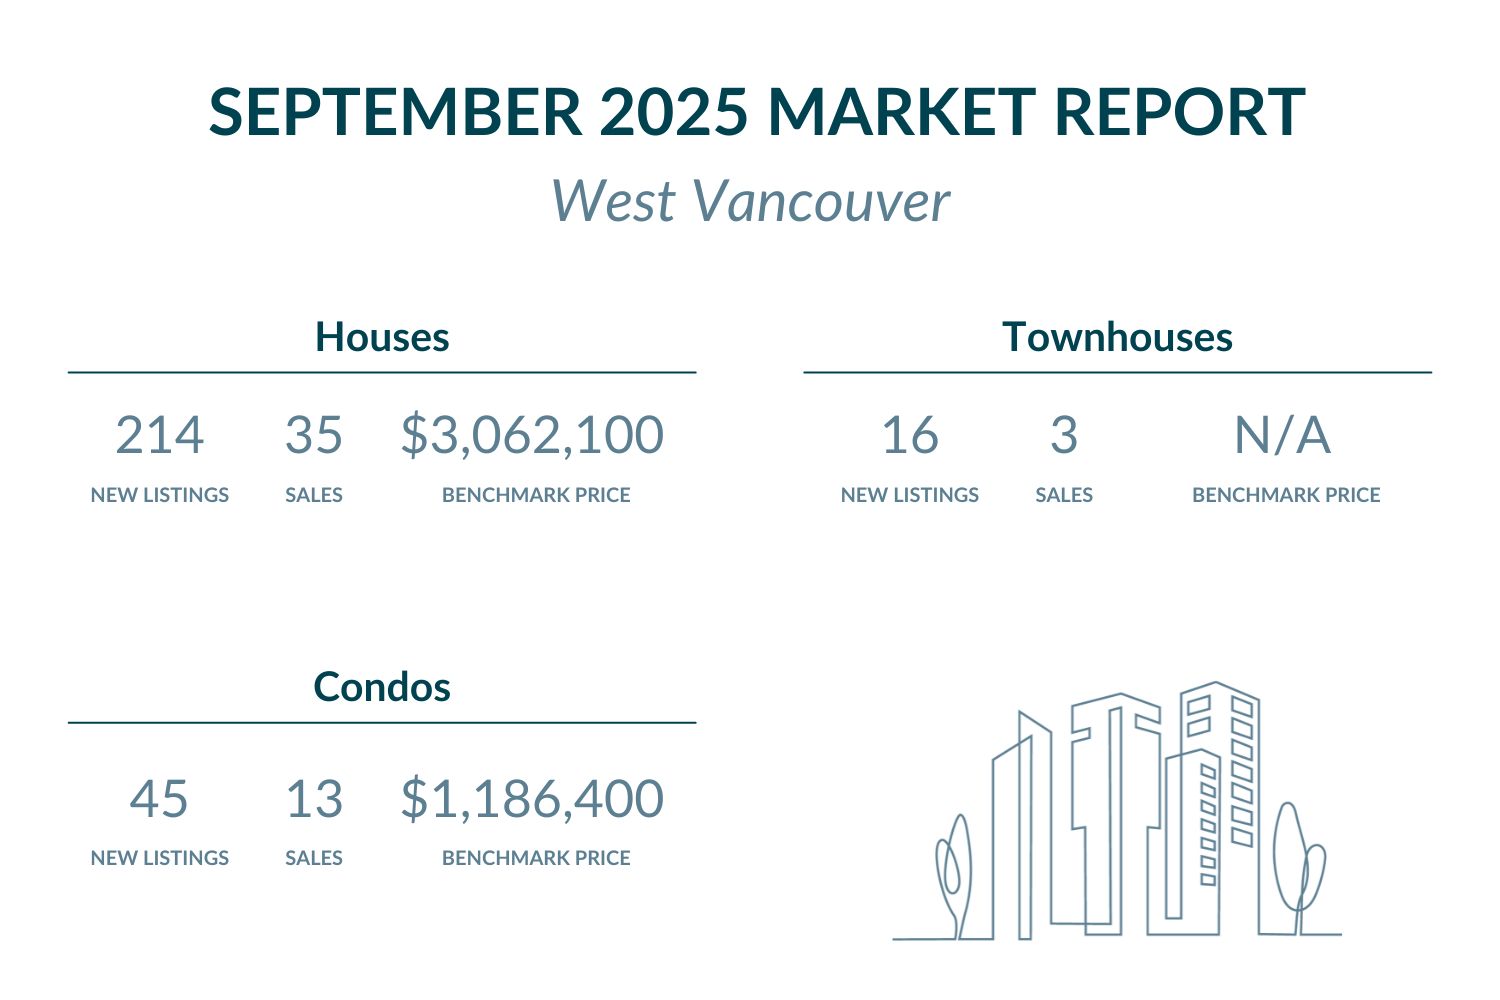
The benchmark price for houses declined 1.4% month-over-month to $3,062,100. However, year-over-year prices decreased 6.3% from September 2024. Currently, West Vancouver commands a substantial premium over Metro Vancouver’s benchmark of $1,933,100. Moreover, this represents approximately $1,129,000 premium above regional averages.
Browse West Vancouver houses listed under $3,065,000 here, or explore upscale options above $3,065,000.
West Vancouver Condos / Apartments:
The benchmark price for condos decreased significantly by 5.5% from August to $1,186,400. Additionally, year-over-year prices fell 4.7% from September 2024. Currently, West Vancouver substantially exceeds Metro Vancouver’s benchmark of $728,800. Therefore, this represents approximately $457,600 premium over regional averages.
View West Vancouver condos listed below $1,190,000 here, or check out high-end selections above $1,190,000.
West Vancouver Real Estate Market Activity:
New listings showed divergent trends across property segments. House new listings increased significantly to 214 from August’s 98. Meanwhile, this marked a substantial 27.1% increase year-over-year. Townhome new listings reached 16, up from August’s 13. Nevertheless, this reflected a 12.5% increase year-over-year. Condo new listings totaled 45, up from August’s 26, though representing a 24.4% decline year-over-year. Active inventory in September was 507 for houses, and 149 for attached homes (condos and townhomes).
Sales activity demonstrated pronounced buyer’s market conditions, particularly for houses. House sales totaled 35 with a 16.4% sales-to-new-listings ratio, indicating strong buyer’s market conditions with substantial negotiating power. Townhome sales reached 3, producing an 18.8% sales-to-new-listings ratio, reflecting soft market conditions. Condo sales totaled 13, yielding a 28.9% sales-to-new-listings ratio, suggesting buyer’s market conditions. Additionally, the sales-to-active-listings ratio for houses reached 4.9%, significantly below Metro Vancouver’s 8.5% baseline. For attached homes combined (condos and townhomes), the sales-to-active-listings ratio achieved 8.7%, underperforming the regional market. These ratios indicate particularly soft conditions in the luxury segment, with houses showing notably weaker demand compared to regional averages while attached homes also demonstrate below-market performance.
View all houses with open houses in West Vancouver here, browse townhomes with open houses here, or explore condos with open houses here.
Metro Vancouver Market Context – North Shore Shows Varied Market Dynamics
September 2025 confirmed that favorable conditions for homebuyers continued across Metro Vancouver. According to Greater Vancouver REALTORS®, Andrew Lis noted: “With another cut to Bank of Canada’s policy rate behind us, and markets pricing in at least one more cut by the end of the year, Metro Vancouver homebuyers have reason to be optimistic about the fall market.” Additionally, he emphasized: “Easing prices, near-record high inventory levels, and increasingly favourable borrowing costs are offering those looking to purchase a home this fall with plenty of opportunity.”
Furthermore, Lis observed: “The past few years have been quite challenging for the market, beginning with 2022’s rapid increase in interest rates, major political and policy shifts in subsequent years, and recent trade tensions with the USA weighing on the market. With the acute impacts of these events now fading, we expect market activity to continue stabilizing to end the year, barring any unforeseeable major disruptions.”
Metro Vancouver’s sales-to-active-listings ratios stood at 8.5% for detached homes, 12.7% for townhouses, and 13.3% for apartments. North Vancouver demonstrated strong relative performance with houses at 12.7% (significantly above Metro), and attached homes combined (condos and townhomes) at 17.3% (outperforming the regional market), indicating notably stronger demand across all segments. Meanwhile, West Vancouver recorded substantially softer conditions with houses at 4.9% (well below Metro) and attached homes combined (condos and townhomes) at 8.7% (underperforming the regional market). The contrast between the two communities reflects North Vancouver’s more accessible price points versus West Vancouver’s ultra-premium positioning in the current buyer-friendly market environment.
Therefore, both North Shore communities continue demonstrating the region’s shift toward buyer-favorable conditions, though with markedly different performance dynamics. North Vancouver’s relative strength reflects balanced market conditions, while West Vancouver’s softness indicates significant negotiating opportunities in the luxury segment.
FAQ – North Shore Real Estate September 2025
Q: Are North Shore home prices rising or falling in September 2025?
A: North Shore prices showed mixed movements in September 2025. North Vancouver houses declined 0.1% monthly while townhouses rose 0.9% and condos fell 0.5%. West Vancouver saw houses drop 1.4% and condos decline 5.5%, reflecting more pronounced adjustments in the ultra-premium segment.
Q: Is it a good time to buy North Shore real estate in September 2025?
A: September 2025 presents favorable buying conditions, particularly in West Vancouver. North Vancouver shows balanced market dynamics with sales-to-active-listings ratios of 12.7% to 17.3%. West Vancouver demonstrates strong buyer’s market conditions with ratios of 4.9% to 8.7%, offering substantial negotiating power for luxury home purchasers.
Q: Which North Shore area offers better real estate value in September 2025?
A: North Vancouver provides more accessible pricing with houses at $2.17M versus West Vancouver’s $3.06M. Additionally, North Vancouver shows stronger market fundamentals with sales-to-active-listings exceeding regional averages across all property types, indicating healthier demand-supply balance.
Q: How does North Vancouver compare to West Vancouver for real estate investment?
A: North Vancouver shows balanced market conditions with sales-to-active-listings at 12.7% for houses (above Metro’s 8.5%) and 17.3% for attached homes, indicating steady demand. West Vancouver offers luxury positioning with houses at 4.9% ratio, presenting opportunities for high-net-worth purchasers with strong negotiating leverage in the ultra-premium segment.
Q: What are the best North Shore communities to buy in September 2025?
A: Both North Vancouver and West Vancouver offer distinct advantages. North Vancouver provides balanced market conditions with premium amenities and strong relative demand across all property types. West Vancouver delivers ultra-luxury positioning with significant price adjustments creating opportunities for well-positioned buyers seeking prestigious waterfront locations.
Featured Buildings


