North Shore Real Estate July 2025 | North Vancouver & West Vancouver Market
Written by Colin Gatward
North Shore real estate July 2025 confirmed the recovery momentum that emerged in June. Subsequently, North Vancouver demonstrated exceptional sales performance across all segments. Moreover, West Vancouver maintained its premium market positioning with steady activity. As a result, both communities significantly outperformed Metro Vancouver benchmarks.
North Vancouver Real Estate July 2025 – Exceptional Sales Performance Drives Market Leadership
North Vancouver real estate market achieved outstanding performance throughout July 2025. Therefore, this created exceptional opportunities for both buyers and sellers.
North Vancouver Housing Market Price Analysis:
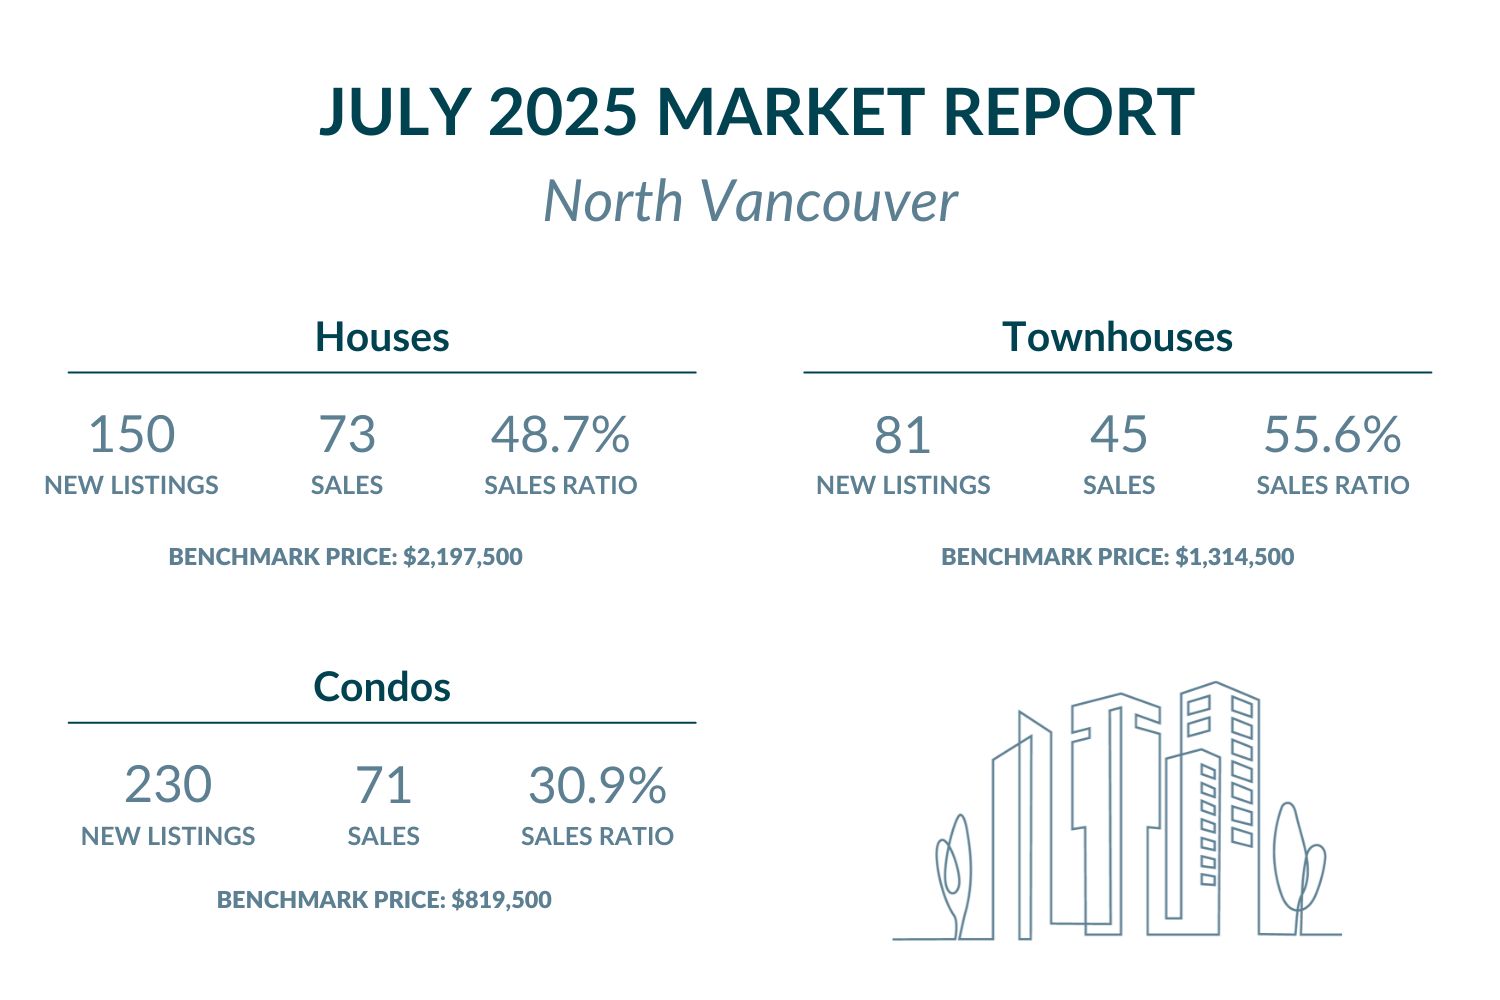
North Vancouver Detached Homes / Houses:
The benchmark price for detached homes declined 0.8% month-over-month to $2,197,500. Furthermore, this represents a 4.2% decrease compared to July 2024. Nevertheless, North Vancouver remains above Metro Vancouver’s benchmark of $1,974,400. Additionally, this commands approximately $223,100 premium over regional averages.
Browse North Vancouver detached homes under $2,200,000 here, or explore available options above $2,200,000.
North Vancouver Townhouses / Attached Homes:
Townhouse prices declined 2.8% from June to $1,314,500. Similarly, year-over-year prices dropped 2.8% from July 2024. Currently, North Vancouver significantly exceeds Metro Vancouver’s benchmark of $1,099,200. Moreover, this represents approximately $215,300 premium above regional standards.
Explore North Vancouver townhomes listed below $1,315,000 here, or check out exclusive properties above $1,315,000.
North Vancouver Condos / Apartments:
Condo prices rose modestly by 0.2% month-over-month to $819,500. Additionally, prices increased 0.6% compared to July 2024. Currently, North Vancouver stays above Metro Vancouver’s benchmark of $743,700. As a result, this represents approximately $75,800 premium over regional averages.
Search North Vancouver condos priced below $820,000 here, or view high-end listings above $820,000.
North Vancouver Real Estate Market Activity:
New listings showed varied trends across different property types. Detached home listings declined to 150 in July, down from June’s 206. Meanwhile, this represented a modest 2.0% year-over-year decrease. Townhouse listings reached 81, down from June’s 108. Nevertheless, this marked a solid 13.6% increase year-over-year. Condo listings rose to 230, up from June’s 211, showing a strong 16.1% year-over-year gain.
Sales activity delivered exceptional results across all property segments. Detached home sales totaled 73 with an outstanding 48.7% sales ratio. Notably, this dramatically outperformed Metro Vancouver’s 10.2% ratio by nearly 5x. Townhouse sales reached 45, producing an impressive 55.6% sales ratio. Furthermore, this substantially exceeded Metro Vancouver’s 16.7% ratio by over 3x. Condo sales totaled 71, yielding a solid 30.9% sales ratio. Particularly, this significantly surpassed Metro Vancouver’s 15.9% ratio by nearly 2x.
Take a look at all the condos in North Vancouver with an open house coming up here.
West Vancouver Real Estate July 2025 – Premium Market Demonstrates Steady Strength
West Vancouver real estate market maintained premium stability throughout July 2025. Consequently, this reinforced continued confidence in the luxury segment.
West Vancouver Housing Market Price Analysis:
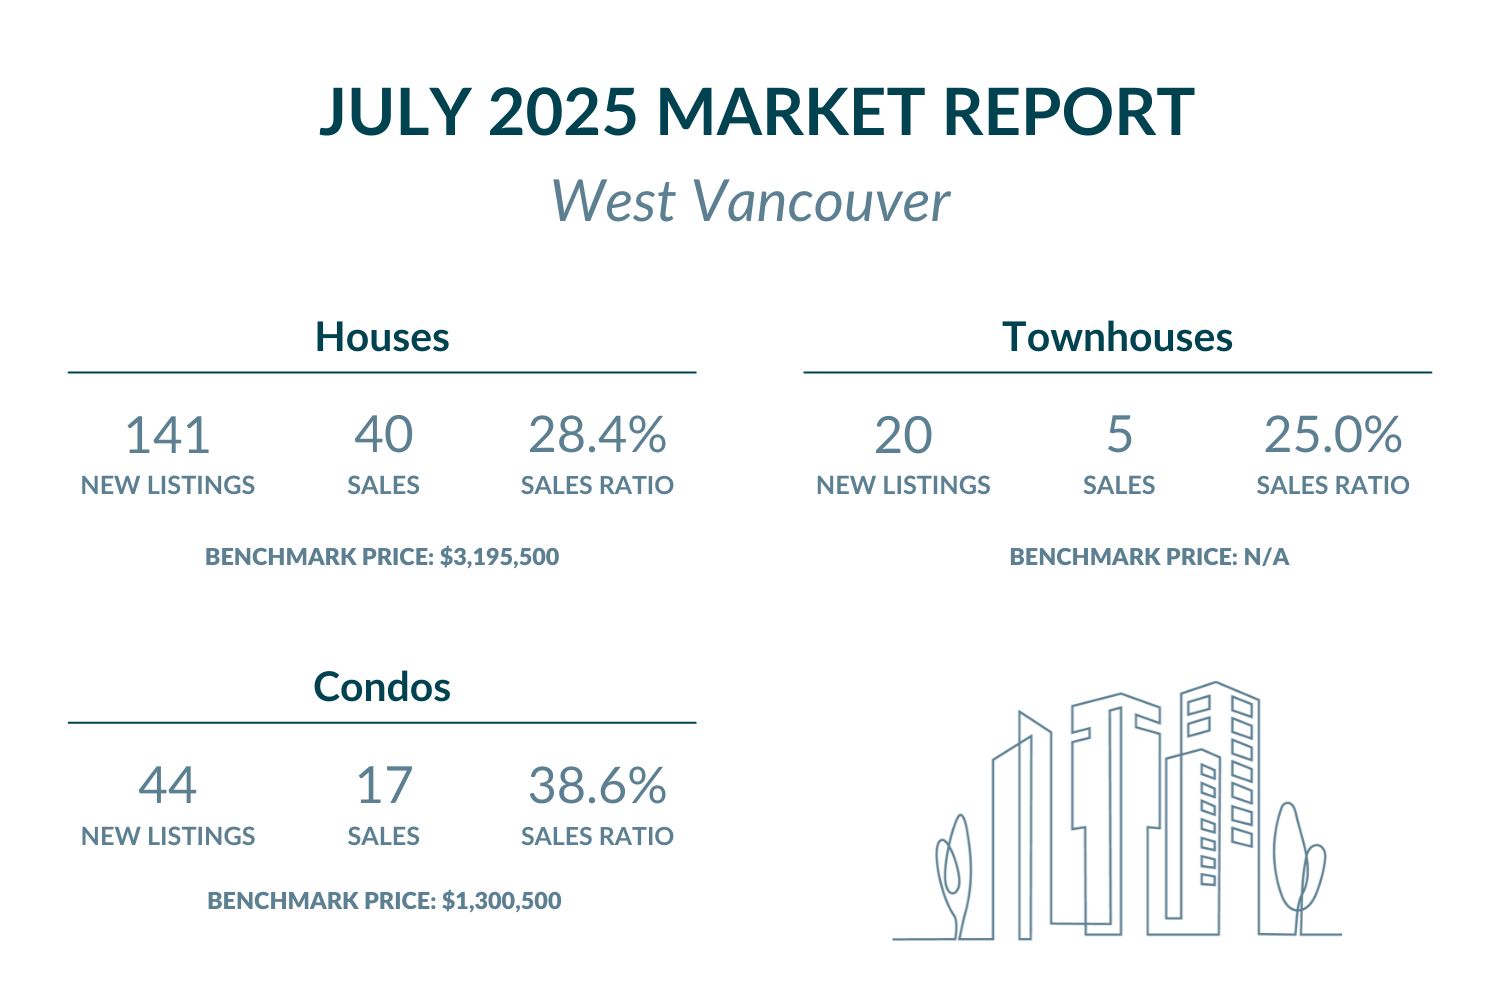
West Vancouver Detached Homes / Houses:
The benchmark price remained virtually stable, rising just 0.1% to $3,195,500. However, year-over-year prices decreased 4.0% from July 2024. Currently, West Vancouver significantly exceeds Metro Vancouver’s benchmark of $1,974,400. Moreover, this commands a substantial premium of approximately $1,221,100.
Browse West Vancouver detached homes listed under $3,200,000 here, or explore upscale options above $3,200,000.
West Vancouver Condos / Apartments:
Condo prices declined 1.8% from June to $1,300,500. Nevertheless, year-over-year prices increased 1.4% from July 2024. Specifically, West Vancouver substantially exceeds Metro Vancouver’s benchmark of $743,700. As a result, this commands approximately $556,800 premium above regional standards.
Check out West Vancouver condos priced under $1,305,000 here, or view listings above $1,305,000 here.
West Vancouver Real Estate Market Activity:
New listings displayed mixed results across property segments. Detached home listings decreased to 141 from June’s 151. Meanwhile, this marked a 4.3% decline year-over-year. Townhouse listings rose to 20, up from June’s 14. However, this reflected a 15.0% decrease year-over-year. Condo listings declined to 44, down from June’s 57, showing a modest 2.3% increase year-over-year.
Sales activity demonstrated solid performance across all property types. Detached home sales totaled 40 with a strong 28.4% sales ratio. Particularly, this significantly outperformed Metro Vancouver’s 10.2% ratio by nearly 3x. Townhouse sales reached 5, producing a solid 25.0% sales ratio. Furthermore, this exceeded Metro Vancouver’s 16.7% ratio by 1.5x. Condo sales totaled 17, yielding an impressive 38.6% sales ratio. Specifically, this substantially surpassed Metro Vancouver’s 15.9% ratio by over 2x.
Take a look at all the condos in West Vancouver with an open house coming up here.
Metro Vancouver Market Context – North Shore Leads Recovery Momentum
July 2025 extended the early recovery signs that emerged in June across Metro Vancouver. According to Greater Vancouver REALTORS®, Andrew Lis confirmed: “these latest figures for July are confirming this emerging trend.” Additionally, the Bank of Canada’s steady policy rate provided certainty for borrowing costs.
Metro Vancouver’s sales ratios established baseline performance at 10.2% for detached homes, 16.7% for townhouses, and 15.9% for condos. However, both North Vancouver and West Vancouver dramatically exceeded these benchmarks. North Vancouver achieved exceptional leadership with outstanding ratios of 48.7% for houses, 55.6% for townhouses, and 30.9% for condos. Meanwhile, West Vancouver recorded impressive performance at 28.4%, 25.0%, and 38.6% respectively.
Currently, inventory levels remain stabilized around 17,000 listings regionwide. Therefore, North Shore communities continue demonstrating sustained buyer interest and market resilience. This sustained performance reflects the area’s fundamental strength during the broader market recovery phase.
Frequently Asked Questions – North Shore Real Estate July 2025
Q: Are North Shore home prices rising or falling in July 2025? A: North Shore prices showed mixed trends in July 2025. North Vancouver houses declined 0.8% monthly while condos rose 0.2%. West Vancouver houses stayed flat with 0.1% gain while condos fell 1.8%.
Q: Is it a good time to buy North Shore real estate in July 2025? A: July 2025 presents excellent buying conditions with exceptional sales ratios confirming strong market recovery. North Vancouver shows 30.9% to 55.6% sales ratios while West Vancouver demonstrates 25.0% to 38.6% ratios, all significantly exceeding Metro Vancouver.
Q: Which North Shore community offers better real estate value in July 2025? A: North Vancouver provides more accessible entry points with houses at $2.2M versus West Vancouver’s $3.2M. However, West Vancouver offers luxury positioning with premium amenities and established prestige in the luxury market.
Q: How does North Vancouver compare to West Vancouver for real estate investment? A: North Vancouver shows exceptional performance with sales ratios up to 55.6% for townhouses and strong fundamentals across all segments. West Vancouver commands higher premiums but offers luxury market stability with consistent high-end buyer demand.
Q: What are the best North Shore cities to buy in July 2025? A: Both North Vancouver and West Vancouver offer distinct advantages. North Vancouver provides exceptional value with outstanding sales performance, while West Vancouver delivers premium luxury living with established market prestige and waterfront amenities.
Featured Buildings


