North Shore Real Estate February 2026 | North Vancouver & West Vancouver Market
Written by Colin Gatward
North Shore real estate February 2026 confirmed the continuation of the new normal as subdued sales activity persisted across both communities. Subsequently, North Vancouver and West Vancouver demonstrated contrasting market dynamics with varied inventory levels. Moreover, new listings showed mixed trends as sellers displayed reluctance to enter the market. As a result, both cities maintained buyer-favorable conditions with North Vancouver showing relative strength compared to West Vancouver’s luxury segment challenges.
North Vancouver Real Estate February 2026 – Modest Resilience Amid Market Softness
North Vancouver real estate market showed modest resilience throughout February 2026. Therefore, this created selective opportunities for buyers across different property segments.
North Vancouver Housing Market Price Analysis:
North Vancouver Detached Homes / Houses:
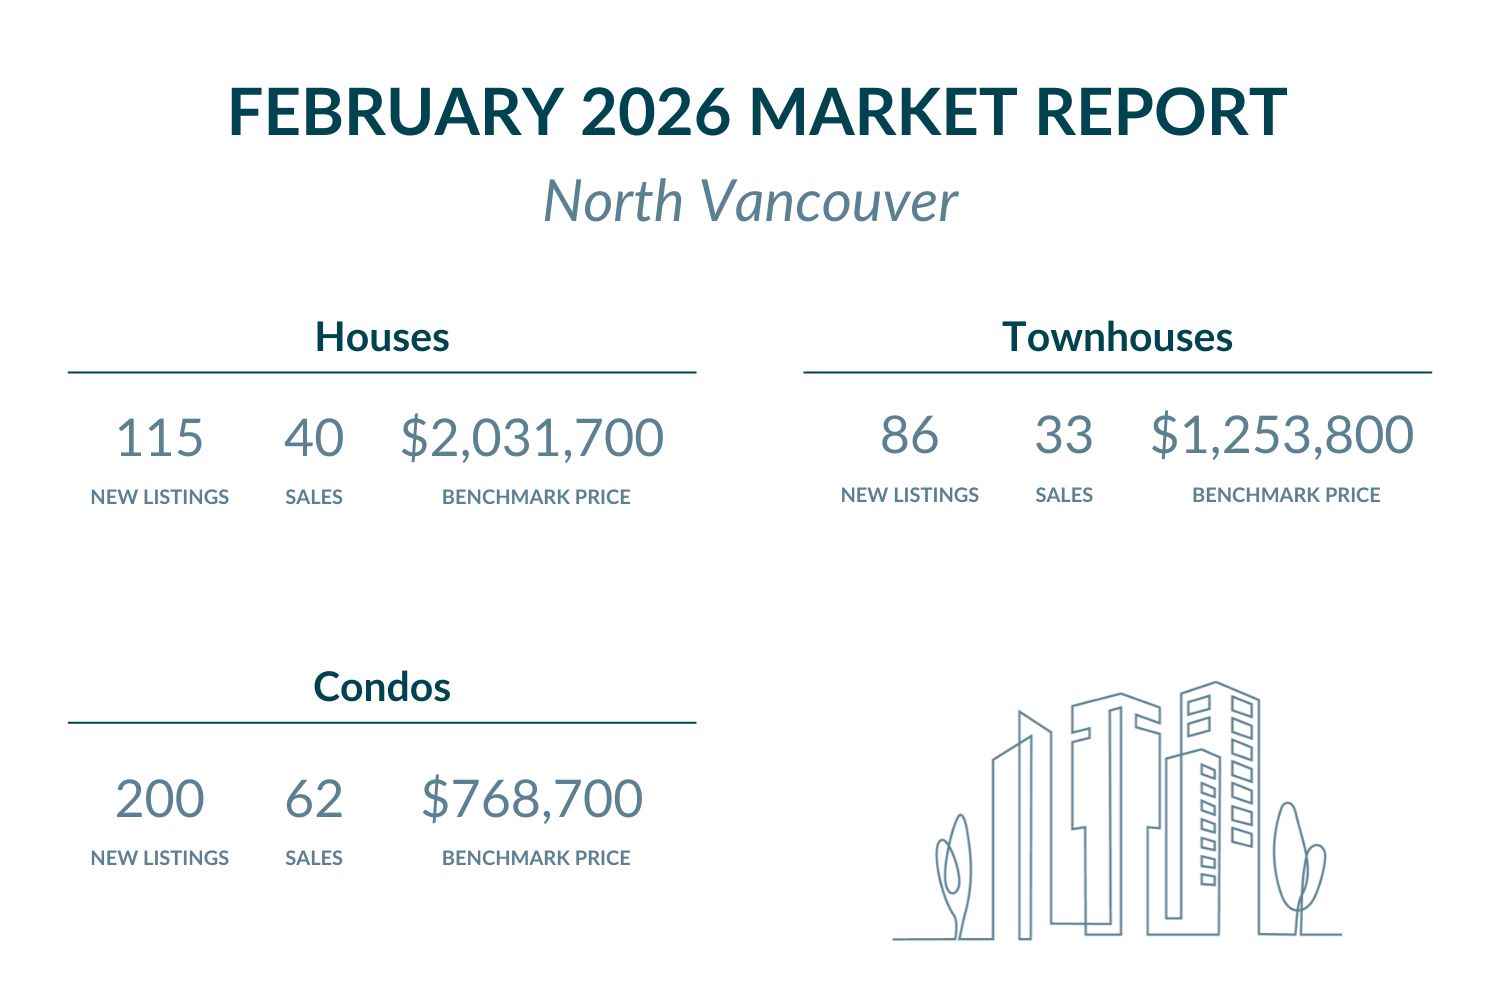
The benchmark price declined modestly by 0.3% month-over-month to $2,031,700. Furthermore, this represents an 8.5% decrease compared to February 2025. Currently, North Vancouver substantially exceeds Metro Vancouver’s benchmark of $1,835,900. Specifically, this commands approximately $195,800 premium above regional averages.
Browse North Vancouver detached homes under $2,030,000 here, or explore available options above $2,030,000.
North Vancouver Townhouses / Attached Homes:
Townhouse prices declined 1.3% from January to $1,253,800. Additionally, year-over-year prices dropped 5.3% from February 2025. Currently, North Vancouver substantially exceeds Metro Vancouver’s benchmark of $1,046,100. As a result, this commands approximately $207,700 premium above regional standards.
Explore North Vancouver townhomes listed below $1,255,000 here, or check out exclusive properties above $1,255,000.
North Vancouver Condos / Apartments:
Condo prices declined 1.5% from January to $768,700. Additionally, year-over-year prices fell 5.6% compared to February 2025. Currently, North Vancouver remains above Metro Vancouver’s benchmark of $708,200. Moreover, this represents approximately $60,500 premium over regional averages.
Search North Vancouver condos priced below $770,000 here, or view high-end listings above $770,000.
North Vancouver Real Estate Market Activity:
New listings showed increasing trends across all property types. Detached home listings reached 115 in February, down from January’s 122. Meanwhile, this represented a 6.1% year-over-year increase. Currently, active inventory stands at 254 detached homes. Townhouse listings totaled 86, down from January’s 99. Nevertheless, this marked a significant 22.1% increase year-over-year. Condo listings reached 200, up from January’s 179, showing a 14.0% year-over-year increase. Active inventory stands at 466 combined townhouses and condos.
Sales activity showed mixed performance across property segments. Detached home sales totaled 40 with a 34.8% sales-to-new-listings ratio, indicating buyer’s market conditions leaning toward balance. Additionally, the sales-to-active-listings ratio reached 15.7%, significantly exceeding Metro Vancouver’s 9.0% baseline. Townhouse sales reached 33, producing a 38.4% sales-to-new-listings ratio, reflecting buyer’s market conditions with improving momentum. Condo sales totaled 62, yielding a 31.0% sales-to-new-listings ratio, suggesting buyer’s market conditions. Furthermore, the combined townhouse and condo sales-to-active-listings ratio achieved 19.7%, exceeding Metro Vancouver’s 16.6% for townhouses and 14.1% for condos. These ratios indicate relatively healthy absorption in North Vancouver despite broader market softness.
- Browse all North Vancouver detached homes with upcoming open houses here.
- Explore North Vancouver townhouses hosting open houses here.
- View all North Vancouver condos with open houses coming up here.
West Vancouver Real Estate February 2026 – Luxury Market Faces Pronounced Headwinds
West Vancouver real estate market faced pronounced challenges throughout February 2026. Consequently, this reflected subdued buyer confidence in the ultra-premium segment.
West Vancouver Housing Market Price Analysis:
West Vancouver Detached Homes / Houses:
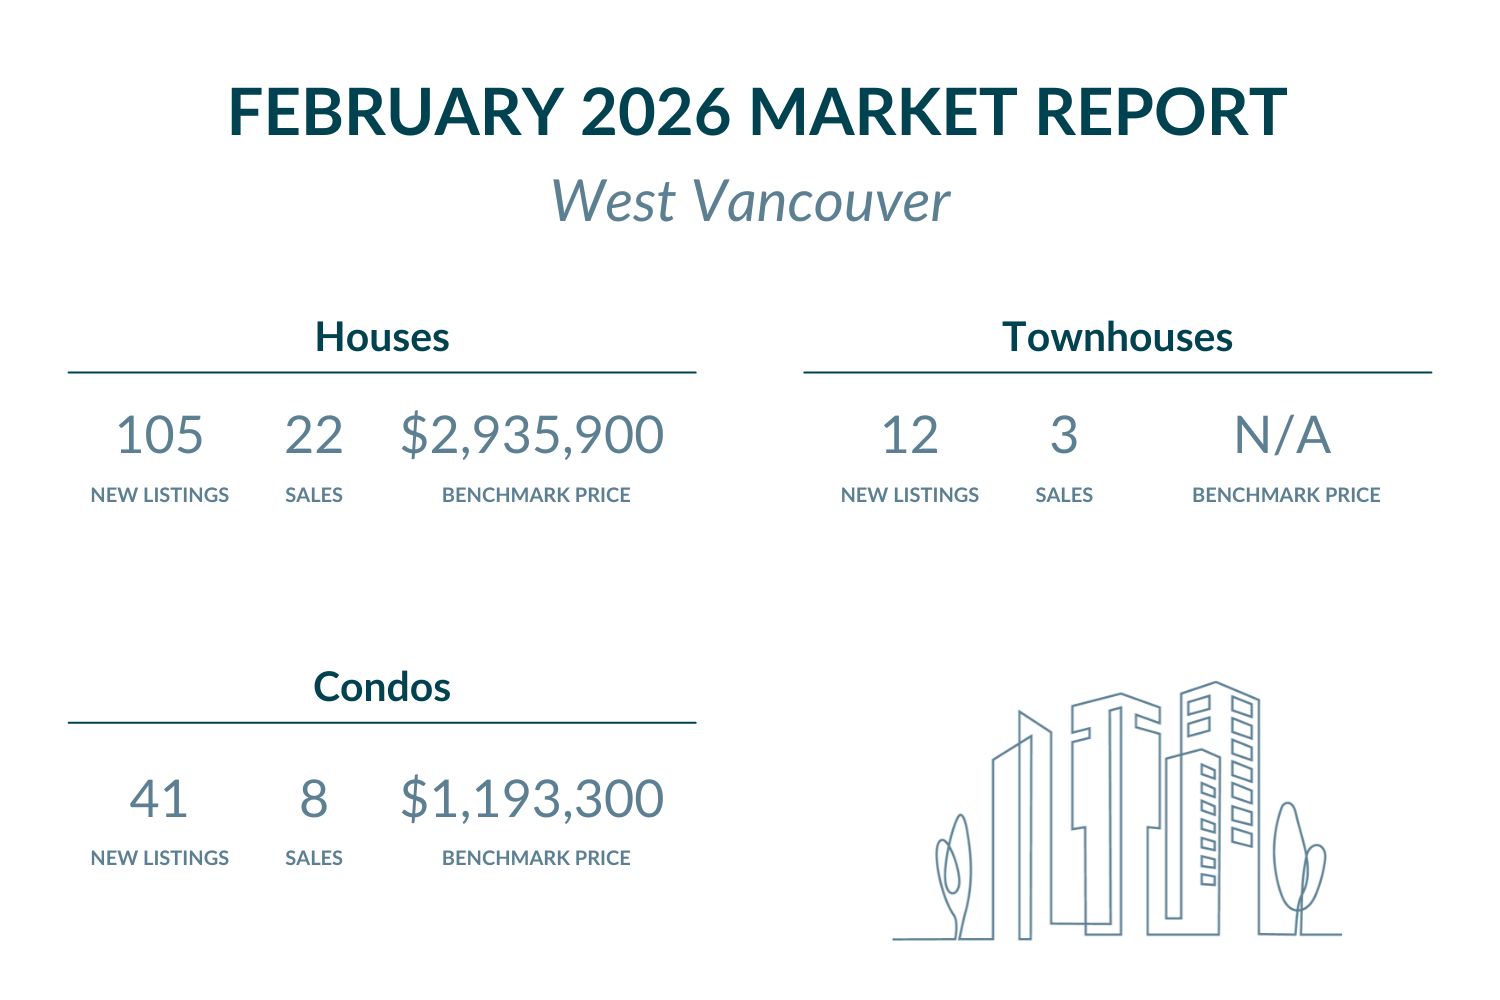
The benchmark price increased 0.7% month-over-month to $2,935,900. However, year-over-year prices decreased 9.2% from February 2025. Currently, West Vancouver dramatically exceeds Metro Vancouver’s benchmark of $1,835,900. Moreover, this commands a substantial premium of approximately $1,100,000.
Browse West Vancouver detached homes listed under $2,935,000 here, or explore upscale options above $2,935,000.
West Vancouver Townhouses / Attached Homes:
Townhouse benchmark data is unavailable due to minimal market activity in this segment.
West Vancouver Condos / Apartments:
Condo prices increased 3.0% from January to $1,193,300. Additionally, year-over-year prices fell 3.7% from February 2025. Currently, West Vancouver substantially exceeds Metro Vancouver’s benchmark of $708,200. Therefore, this represents approximately $485,100 premium over regional averages.
View West Vancouver condos listed below $1,195,000 here, or check out high-end selections above $1,195,000.
West Vancouver Real Estate Market Activity:
New listings displayed sharply divergent trends across property segments. Detached home new listings reached 105 from January’s 158. Meanwhile, this marked a significant 20.0% decline year-over-year. Currently, active inventory stands at 400 detached homes. Townhouse new listings totaled 12, up from January’s 11. Nevertheless, this reflected a 41.7% decline year-over-year. Condo new listings reached 39, down from January’s 41, representing a 25.6% increase year-over-year. Active inventory stands at 129 combined condos and townhouses.
Sales activity showed subdued performance across all property types. Detached home sales totaled 22 with a 20.9% sales-to-new-listings ratio, indicating deep buyer’s market conditions. Additionally, the sales-to-active-listings ratio reached 5.5%, significantly below Metro Vancouver’s 9.0% baseline. Townhouse sales reached 3, producing a 25.0% sales-to-new-listings ratio, reflecting buyer’s market conditions. Condo sales totaled 8, yielding a 20.5% sales-to-new-listings ratio, suggesting buyer’s market conditions. Furthermore, the combined condo and townhouse sales-to-active-listings ratio achieved 8.5%, well below Metro Vancouver’s 16.6% for townhouses and 14.1% for condos. These ratios demonstrate pronounced buyer’s market conditions in West Vancouver’s luxury segment.
- Discover West Vancouver detached homes with upcoming open houses here.
- Check out West Vancouver condos with open houses coming up here.
Metro Vancouver Market Context – New Normal Persists With Seller Reluctance
February 2026 confirmed the continuation of Metro Vancouver’s new normal with sales running well below long-term averages. According to Greater Vancouver REALTORS®, Andrew Lis noted: “With each passing data point, the pace of sales running well-below long-term averages are no longer a surprise – it’s become the new norm.”
Furthermore, Lis observed a surprising development: “home sellers appear less eager to list their homes relative to last year with new listings down about seven percent, mostly driven by fewer listings in the apartment segment.” Additionally, he noted: “With fewer sellers coming to market with their properties than last year, a pick-up in demand heading into the spring could result in a stagnation of standing inventory, which may support prices around current levels.”
Metro Vancouver’s sales-to-active-listings ratios stood at 9.0% for detached homes, 16.6% for townhouses, and 14.1% for condos. North Vancouver showed stronger absorption compared to these benchmarks, with houses achieving 15.7% (significantly above Metro’s 9.0%), and combined multi-family at 19.7% (exceeding both Metro’s townhouse 16.6% and condo 14.1%). Meanwhile, West Vancouver recorded subdued results with houses at 5.5% (well below Metro’s 9.0%), and combined multi-family at 8.5% (significantly below Metro’s townhouse 16.6% and condo 14.1%).
The contrast between the two North Shore cities is striking. North Vancouver demonstrates relative market strength with absorption rates exceeding regional benchmarks, while West Vancouver faces pronounced challenges in the ultra-luxury segment. Therefore, the North Shore presents a tale of two markets with North Vancouver offering opportunities amid modest buyer confidence, while West Vancouver provides deep buyer’s market conditions for those seeking premium properties. As Lis concluded: “the spring market will be the litmus test of whether we continue along this new normal, or if we see any significant surprises.”
Frequently Asked Questions – North Shore Real Estate February 2026
Q: Are North Shore home prices rising or falling in February 2026?
A: North Shore prices showed mixed movement in February 2026. North Vancouver houses declined 0.3% monthly, townhouses fell 1.3%, and condos dropped 1.5%. West Vancouver saw houses rise 0.7% and condos increase 3.0%, reflecting varied luxury market dynamics.
Q: Is it a good time to buy North Shore real estate in February 2026?
A: February 2026 presents strong buying conditions with buyer-favorable dynamics. North Vancouver shows sales-to-active-listings ratios of 15.7% for houses and 19.7% for multi-family, while West Vancouver demonstrates 5.5% to 8.5% ratios. West Vancouver’s luxury market offers particularly strong negotiating power for buyers.
Q: Which North Shore city offers better real estate value in February 2026?
A: North Vancouver provides superior relative value with houses at $2.0M versus West Vancouver’s $2.9M. Additionally, North Vancouver shows stronger absorption at 15.7%-19.7% sales-to-active-listings ratios, significantly exceeding Metro Vancouver benchmarks and indicating healthier market fundamentals.
Q: How does North Vancouver compare to West Vancouver for real estate investment?
A: North Vancouver shows exceptional relative strength with 15.7% house and 19.7% multi-family absorption, both exceeding Metro Vancouver averages. West Vancouver offers luxury market opportunities at 5.5%-8.5% absorption with maximum negotiating leverage in the ultra-premium segment.
Q: What are the best North Shore communities to buy in February 2026?
A: Both North Vancouver and West Vancouver offer distinct advantages. North Vancouver provides relative market strength with above-Metro absorption and premium positioning, while West Vancouver delivers ultra-luxury opportunities with deep buyer’s market conditions and substantial negotiating power for high-end purchasers.
Featured Buildings


