North Shore Real Estate December 2025 | North Vancouver & West Vancouver Market
Written by Colin Gatward
North Shore real estate December 2025 closed out a year that marked the lowest annual sales total in over two decades for Metro Vancouver. Subsequently, the two North Shore municipalities demonstrated dramatically divergent market conditions throughout the final month. Moreover, North Vancouver maintained relatively balanced fundamentals while West Vancouver experienced significant softening. As a result, both communities entered 2026 with distinct opportunities reflecting their unique market positions within the broader historic context.
North Vancouver Real Estate December 2025 – Resilient Fundamentals Amid Historic Year
North Vancouver real estate market demonstrated resilient fundamentals as the historic year concluded. Therefore, this created balanced opportunities despite the challenging broader market environment.
North Vancouver Housing Market Price Analysis:
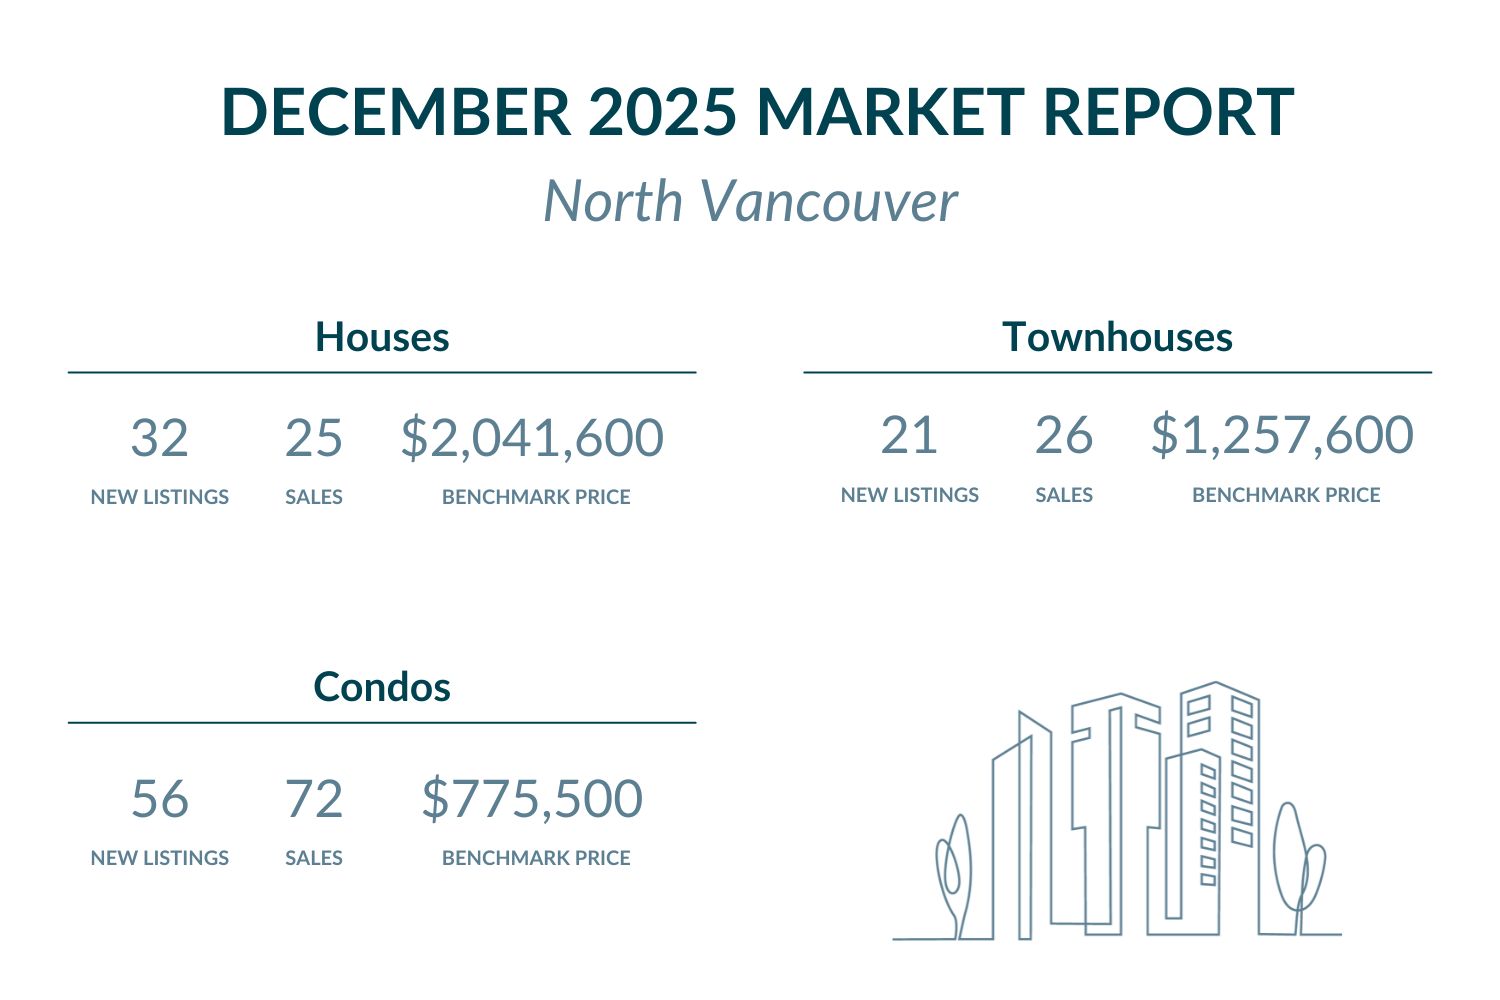
North Vancouver Detached Homes / Houses:
The benchmark price declined 2.9% month-over-month to $2,041,600. Furthermore, this represents a 3.8% decrease compared to December 2024. Currently, North Vancouver exceeds Metro Vancouver’s benchmark of $1,879,800. Specifically, this commands approximately $161,800 premium above regional averages.
Browse North Vancouver detached homes under $2,045,000 here, or explore available options above $2,045,000.
North Vancouver Townhouses / Attached Homes:
Townhouse prices declined 2.6% from November to $1,257,600. Additionally, year-over-year prices dropped 4.3% from December 2024. Currently, North Vancouver exceeds Metro Vancouver’s benchmark of $1,056,600. As a result, this commands approximately $201,000 premium above regional standards.
Explore North Vancouver townhomes listed below $1,260,000 here, or check out exclusive properties above $1,260,000.
North Vancouver Condos / Apartments:
Condo prices declined 2.1% from November to $775,500. However, prices decreased 2.8% compared to December 2024. Currently, North Vancouver remains above Metro Vancouver’s benchmark of $710,000. Moreover, this represents approximately $65,500 premium over regional averages.
Search North Vancouver condos priced below $780,000 here, or view high-end listings above $780,000.
North Vancouver Real Estate Market Activity:
New listings showed mixed year-over-year results across property types. Detached home listings totaled 32 in December, down from November’s 89. Meanwhile, this represented an 18.8% year-over-year increase. Active inventory stood at 200 detached homes. Townhouse listings reached 21, down from November’s 60. Nevertheless, this showed a 4.8% year-over-year decline. Condo listings totaled 56, down from November’s 137, marking a 5.4% year-over-year increase. Active inventory for townhouses and condos combined stood at 311 units.
Sales activity showed robust demand across multi-family segments. Detached home sales totaled 25 with a 78.1% sales-to-new-listings ratio, indicating seller’s market conditions with strong demand. Additionally, the sales-to-active-listings ratio reached 12.5%, exceeding Metro Vancouver’s 9.3% baseline. Townhouse sales reached 26, producing a remarkable 123.8% sales-to-new-listings ratio, reflecting exceptional seller’s market conditions with demand outpacing new supply. Condo sales totaled 72, yielding a 128.6% sales-to-new-listings ratio, suggesting very strong seller’s market conditions for apartments. Furthermore, the combined sales-to-active-listings ratio for townhouses and condos achieved 30.5%, dramatically exceeding both Metro Vancouver’s townhouse baseline of 14.6% and condo baseline of 15.1%. These ratios indicate exceptional absorption fundamentals heading into 2026, with North Vancouver demonstrating particularly strong demand relative to inventory levels despite the historic challenges facing the broader Metro Vancouver market.
- Discover all North Vancouver detached homes with upcoming open houses here.
- Find North Vancouver townhouses hosting open houses here.
- Check out all North Vancouver condos with open houses coming up here.
West Vancouver Real Estate December 2025 – Ultra-Premium Market Faces Significant Headwinds
West Vancouver real estate market experienced significant challenges as the historic year concluded. Consequently, this created pronounced buyer-favorable conditions particularly across the luxury segments.
West Vancouver Housing Market Price Analysis:
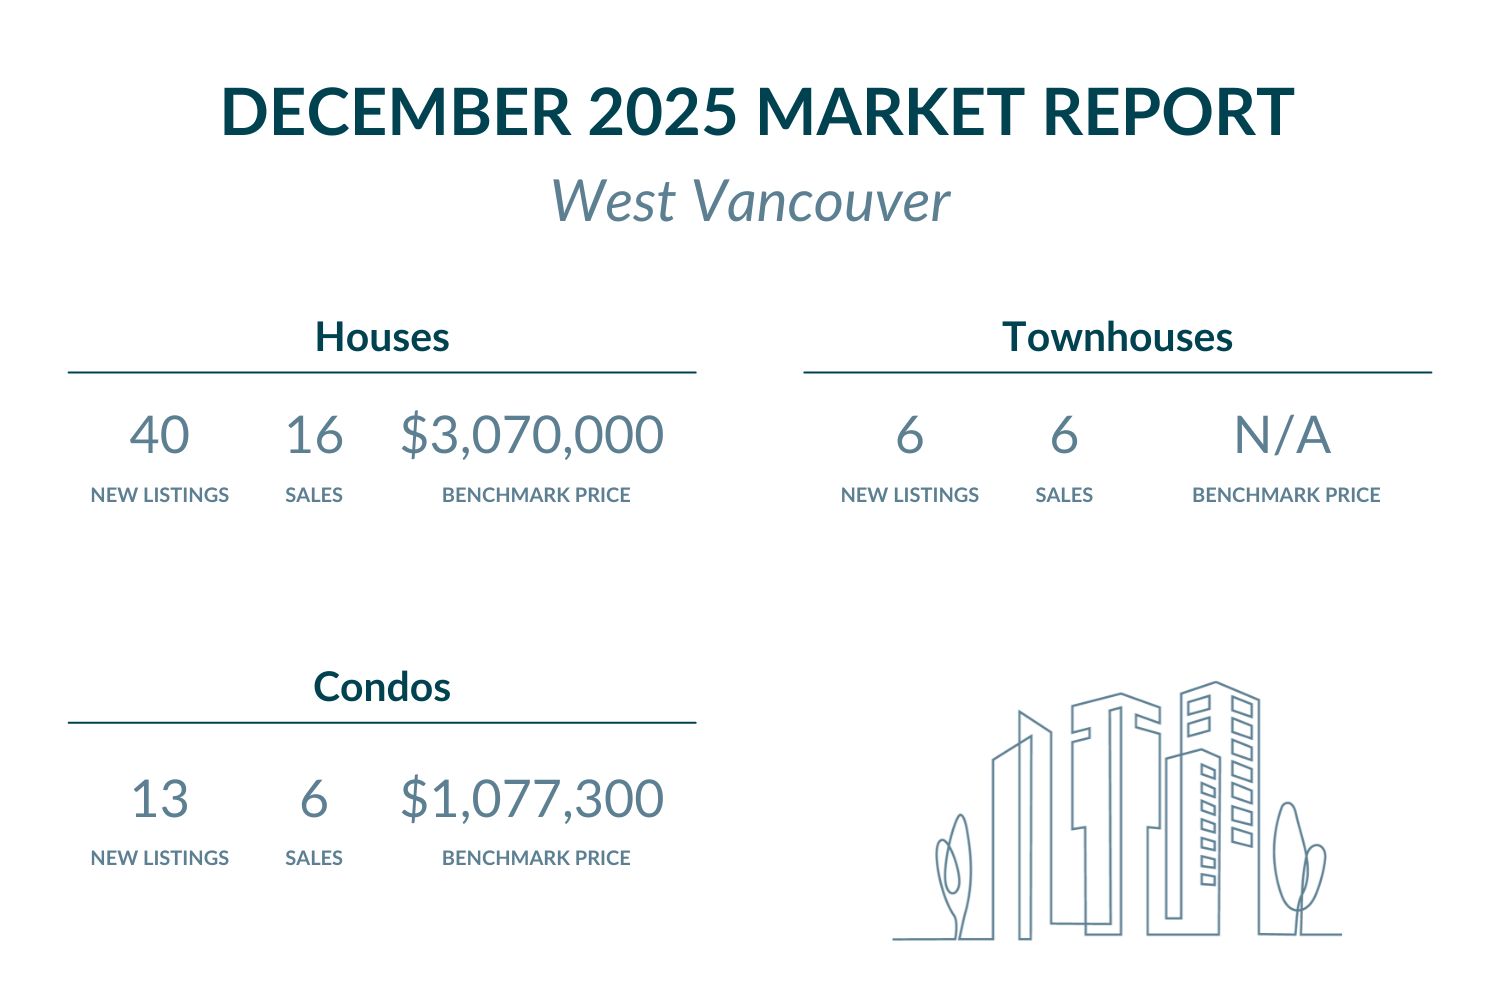
West Vancouver Detached Homes / Houses:
The benchmark price declined 1.6% month-over-month to $3,070,000. However, year-over-year prices decreased 6.6% from December 2024. Currently, West Vancouver dramatically exceeds Metro Vancouver’s benchmark of $1,879,800. Moreover, this commands a substantial premium of approximately $1,190,200.
Browse West Vancouver detached homes listed under $3,075,000 here, or explore upscale options above $3,075,000.
West Vancouver Condos / Apartments:
Condo prices declined 5.5% from November to $1,077,300. Additionally, year-over-year prices fell 10.8% from December 2024. Currently, West Vancouver substantially exceeds Metro Vancouver’s benchmark of $710,000. Therefore, this represents approximately $367,300 premium over regional averages.
View West Vancouver condos listed below $1,080,000 here, or check out high-end selections above $1,080,000.
West Vancouver Real Estate Market Activity:
New listings displayed declining year-over-year trends across most segments. Detached home new listings decreased to 40 from November’s 81. Meanwhile, this marked a 25.0% year-over-year decline. Active inventory stood at 363 detached homes. Townhouse new listings remained at 6, unchanged from November, showing a 50.0% year-over-year increase though reflecting minimal activity. Condo new listings totaled 13, down from November’s 28, representing a significant 69.2% year-over-year decline. Active inventory for condos and townhouses combined stood at 99 units.
Sales activity showed significantly subdued market dynamics across property types. Detached home sales totaled 16 with a 40.0% sales-to-new-listings ratio, indicating balanced market conditions with slight buyer advantage. Additionally, the sales-to-active-listings ratio reached 4.4%, significantly below Metro Vancouver’s 9.3% baseline. Townhouse sales reached only 6, producing a 100.0% sales-to-new-listings ratio, though reflecting minimal market activity in this segment. Condo sales totaled 6, yielding a 46.2% sales-to-new-listings ratio, suggesting balanced conditions. Furthermore, the combined sales-to-active-listings ratio for condos and townhouses achieved 8.1%, falling significantly below both Metro Vancouver’s townhouse baseline of 14.6% and condo baseline of 15.1%. These ratios demonstrate pronounced buyer-favorable conditions with elevated inventory levels relative to demand, particularly in the ultra-luxury detached segment where absorption fell to less than half of Metro Vancouver’s baseline despite the premium market positioning.
- Browse West Vancouver detached homes with upcoming open houses here.
- View West Vancouver condos with open houses coming up here.
Metro Vancouver Market Context – Historic Year Concludes With Divergent North Shore Dynamics
December 2025 concluded a year for the history books in Metro Vancouver real estate, with the North Shore exemplifying the market’s divergent dynamics. According to Greater Vancouver REALTORS®, Andrew Lis noted: “This year was one for the history books. Although the sales total was the lowest in over two decades, Realtors were still busy listing properties. Sellers brought the highest total of listings to market on record since the mid-1990s, eclipsing the previous record high in 2008 by a little over 1,000 listings.”
Furthermore, Lis observed: “The forecast we put out last January noted a foreseeable downside risk, which while prescient, unfortunately materialized in 2025. Specifically, we noted that trade tensions with the USA could negatively impact sales and prices, and this downside risk came to pass.” However, he added: “The upshot, however, is that the negative impact of these trade tensions appears to be easing, and consumer sentiment has improved modestly over the second half of the year.”
Regarding market conditions entering 2026, Lis commented: “With lower prices, lower borrowing costs, and plenty of inventory to choose from, homebuyers in 2026 are starting the year with favorable conditions. Whether these conditions translate into a market with stronger demand will be the million-dollar question – and we’ll be monitoring this story closely as it unfolds.”
Metro Vancouver’s sales-to-active-listings ratios stood at 9.3% for detached homes, 14.6% for townhouses, and 15.1% for condos. North Vancouver demonstrated exceptional performance compared to these benchmarks, with houses achieving 12.5% (exceeding Metro’s baseline by 3.2 percentage points), and combined townhouses and condos reaching a remarkable 30.5% (more than double Metro’s townhouse baseline and double the condo baseline). This exceptional absorption indicates particularly robust demand relative to available inventory in North Vancouver.
Meanwhile, West Vancouver recorded significantly subdued results with houses at 4.4% (less than half of Metro’s 9.3% baseline), and combined condos and townhouses at 8.1% (falling well below both Metro’s townhouse average of 14.6% and condo average of 15.1%). The stark divergence between North Vancouver’s exceptional absorption (30.5% combined multi-family) and West Vancouver’s softening demand (8.1% combined) highlights the dramatically different dynamics within the North Shore market as 2025 concluded.
Therefore, the North Shore communities concluded 2025 demonstrating radically divergent market characteristics. North Vancouver’s exceptional absorption metrics suggest sustained buyer interest and healthy fundamentals despite the historic challenges, while West Vancouver’s pronounced buyer-favorable conditions reflect the unique pressures facing ultra-luxury markets during periods of economic uncertainty and elevated inventory levels.
FAQ – North Shore Real Estate December 2025
Q: Are North Shore home prices rising or falling in January 2026?
A: North Shore prices declined through December 2025. North Vancouver houses fell 2.9% monthly and 3.8% annually, townhouses declined 2.6% monthly and 4.3% annually, while condos dropped 2.1% monthly and 2.8% annually. West Vancouver saw houses decrease 1.6% monthly and 6.6% annually, while condos fell 5.5% monthly and 10.8% annually, reflecting year-end price adjustment amid historic market softening.
Q: Is it a good time to buy North Shore real estate in January 2026?
A: January 2026 presents dramatically different opportunities across municipalities based on December’s performance. North Vancouver shows exceptional fundamentals with houses at 12.5% sales-to-active-listings (exceeding Metro’s 9.3%) and combined townhouses/condos at 30.5% (more than double Metro benchmarks), indicating strong demand. West Vancouver demonstrates pronounced buyer-favorable conditions with houses at 4.4% (less than half Metro’s baseline) offering significant negotiating opportunities in the ultra-luxury segment.
Q: Which North Shore area offers better real estate value in January 2026?
A: North Vancouver provides superior value with houses at $2.0M versus West Vancouver’s $3.1M. Additionally, North Vancouver demonstrates exceptional market strength with combined multi-family absorption at 30.5% (more than double Metro Vancouver’s 14.6% townhouse and 15.1% condo baselines), indicating sustained demand and price stability despite the historic market challenges.
Q: How does North Vancouver compare to West Vancouver for real estate investment in January 2026?
A: North Vancouver shows exceptional fundamentals with robust absorption across all segments—houses at 12.5% sales-to-active-listings (exceeding Metro’s 9.3%) and combined multi-family at 30.5% (dramatically exceeding Metro). West Vancouver offers ultra-luxury positioning with pronounced buyer-favorable conditions in detached homes (4.4% ratio, less than half Metro’s baseline) providing significant negotiating opportunities for high-net-worth purchasers seeking premium waterfront properties at adjusted valuations.
Q: What are the best North Shore communities to buy in January 2026?
A: Both North Shore municipalities offer distinct opportunities entering 2026. North Vancouver provides excellent value with below-West-Vancouver pricing and exceptional demand fundamentals (30.5% combined multi-family absorption versus Metro’s 14.6%-15.1%), positioning it favorably for recovery. West Vancouver delivers ultra-luxury positioning with significant buyer leverage in the detached segment (4.4% absorption versus Metro’s 9.3%), ideal for purchasers seeking premium waterfront properties with substantial negotiating power following 2025’s historic adjustment.
Featured Buildings


