Vancouver real estate in June 2026 showed early signs of renewed demand across Vancouver East and Vancouver West. House sales rose year-over-year in both cities, while townhouse and condo performance stayed mixed. Additionally, benchmark prices held relatively steady month-over-month even as annual declines persisted across most segments. Consequently, buyers entering the market in June continued to find solid selection alongside steady, if uneven, absorption.
Vancouver East Real Estate — June 2026
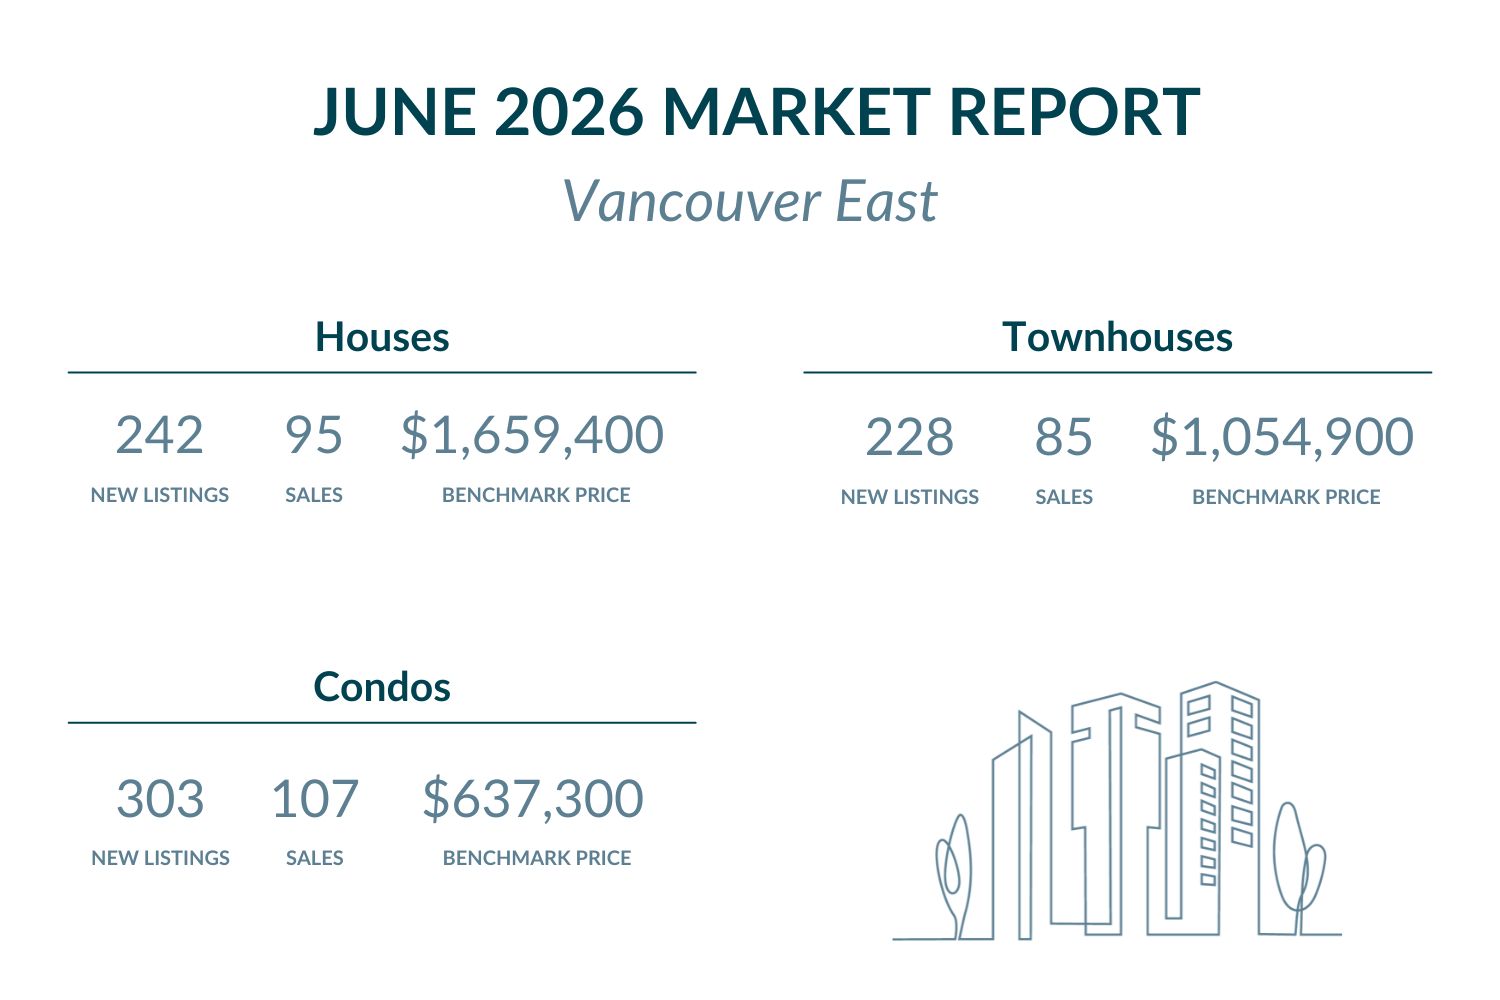
Vancouver East delivered a steady performance in June 2026, with house sales holding flat year-over-year while attached home activity surged. Nevertheless, benchmark prices moved only modestly month-over-month across all three property types.
Price Analysis — Vancouver East
Vancouver East Houses:
The benchmark price for houses in Vancouver East reached $1,659,400 in June 2026, a 0.3% increase from May 2026. Year-over-year, however, the benchmark still declined 9.6% compared to June 2025. Furthermore, Metro Vancouver’s house benchmark stood at $1,842,900 in June 2026. This places Vancouver East approximately $183,500 below the regional standard. Consequently, Vancouver East continues to offer meaningful value relative to the broader Metro average for houses.
Browse Vancouver East houses listed under $1,659,400 here, or explore available options above $1,659,400.
Vancouver East Attached Homes (Townhomes & Duplexes):
The attached homes benchmark in Vancouver East reached $1,054,900 in June 2026, a 1.1% month-over-month decline. Year-over-year, the benchmark also fell 3.5% from June 2025. Additionally, Metro Vancouver’s townhouse benchmark stands at $1,046,200. Vancouver East attached homes therefore carry a marginal $8,700 premium above that regional average. As a result, Vancouver East attached homes remain priced closely in line with the broader Metro benchmark.
Search attached homes and townhomes in Vancouver East under $1,054,900 here, or view attached homes and townhomes above $1,054,900.
Vancouver East Condos:
The condo benchmark in Vancouver East reached $637,300 in June 2026, a 0.5% month-over-month decline. Year-over-year, the benchmark fell 7.2% compared to June 2025. Moreover, Metro Vancouver’s condo benchmark of $695,200 places Vancouver East condos approximately $57,900 below the regional standard. Consequently, this segment remains one of the more accessible condo entry points across Metro Vancouver.
Find Vancouver East condos listed under $637,300 here, or see all condos priced above $637,300.
Market Activity — Vancouver East
Detached home new listings rose to 242 in June 2026, up from 233 in May. Year-over-year, however, new house supply fell 2.5% from the 248 houses listed in June 2025. Active inventory stands at 692 houses. Attached (Townhomes and Duplexes) climbed to 228 new listings in June, up from 214 in May. Year-over-year, new attached supply increased 14.5% compared to June 2025. Active inventory for townhouses stands at 175 units. Condo new listings rose to 303 in June, up sharply from 256 in May. Furthermore, new condo supply slipped 0.7% year-over-year from the 305 condos listed in June 2025. Active condo inventory stands at 594 units.
House sales in Vancouver East reached 95 in June 2026, unchanged year-over-year from the 95 sales recorded in June 2025. Subsequently, the sales-to-new-listings ratio (SNLR) reached 39.3%, indicating buyer’s market conditions. The sales-to-active-listings ratio for houses stood at 13.7%, above Metro Vancouver’s 12.0% baseline for houses. Attached home sales totalled 85 in June 2026, a 32.8% increase year-over-year from the 64 sales in June 2025. The attached homes SNLR of 37.3% continued to signal buyer’s market territory. Meanwhile, 32 townhouse sales against 175 active units produced a townhouse sales-to-active-listings ratio of 18.3%, closely matching Metro Vancouver’s 17.8% townhouse baseline. Condo sales totalled 107 in June 2026, a 0.9% decline year-over-year from the 108 sales in June 2025. The SNLR for condos reached 35.3%, indicating buyer’s market conditions. Additionally, the condo sales-to-active-listings ratio reached 18.0%, above Metro Vancouver’s 15.5% condo baseline.
- Check houses with open houses in Vancouver East here
- Browse townhomes with open houses in Vancouver East
- Find condos with open houses in Vancouver East
Vancouver West Real Estate — June 2026
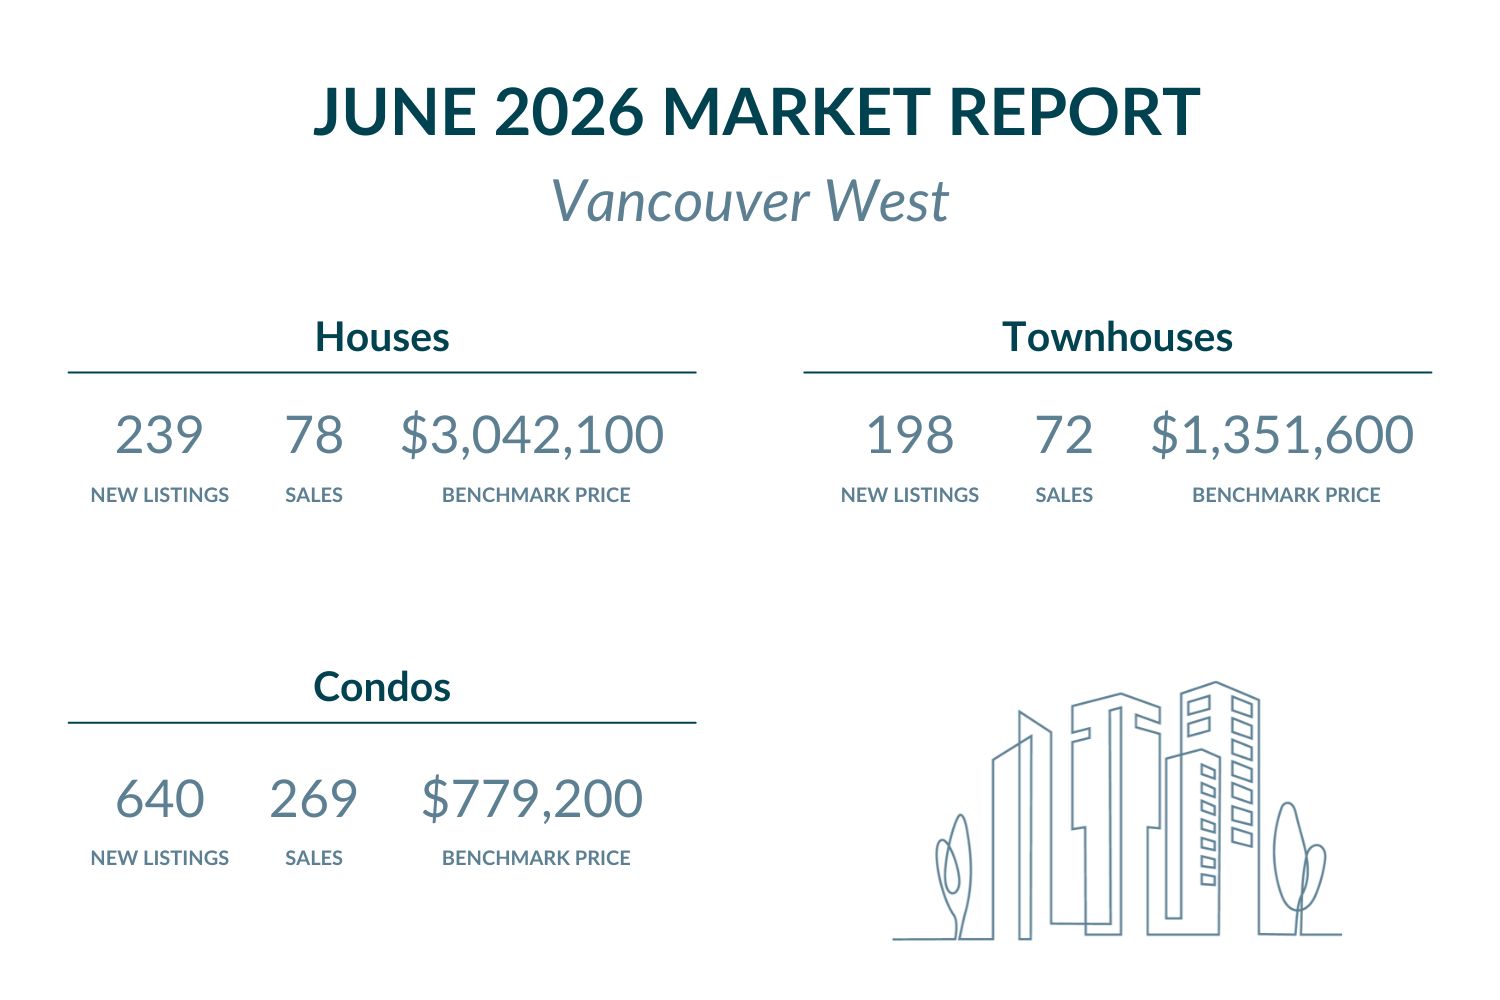
Vancouver West recorded broad-based sales gains across all three property types in June 2026. However, benchmark prices continued their year-over-year correction even as monthly figures firmed for houses and attached homes.
Price Analysis — Vancouver West
Vancouver West Houses:
The benchmark price for houses in Vancouver West reached $3,042,100 in June 2026, a 0.6% monthly increase from May. Year-over-year, however, the benchmark declined 9.2% from June 2025. Furthermore, Metro Vancouver’s house benchmark stood at $1,842,900 in June 2026. Vancouver West houses carry a premium of approximately $1,199,200 above that regional standard. Consequently, this segment reflects Vancouver West’s established positioning at the upper end of Metro Vancouver’s market.
Browse Vancouver West houses listed under $3,042,100 here, or discover available homes priced above $3,042,100.
Vancouver West Attached Homes (Townhomes & Duplexes):
The attached homes benchmark in Vancouver West reached $1,351,600 in June 2026, a 1.5% monthly increase. Year-over-year, the benchmark still fell 5.4% from June 2025. Additionally, Metro Vancouver’s townhouse benchmark of $1,046,200 places Vancouver West attached homes at a premium of approximately $305,400 above the regional average. As a result, this segment continues to reflect Vancouver West’s premium positioning across all property types.
Search attached homes and townhomes in Vancouver West under $1,351,600 here, or explore attached homes and townhomes above $1,351,600.
Vancouver West Condos:
The condo benchmark in Vancouver West reached $779,200 in June 2026, a 0.5% monthly decline. Year-over-year, the benchmark fell 5.6% from June 2025. Moreover, Metro Vancouver’s condo benchmark of $695,200 places Vancouver West condos at a premium of approximately $84,000 above the regional average. Specifically, this represents a moderate premium relative to the larger gaps seen across Vancouver West’s house and townhouse segments.
Find Vancouver West condos listed under $779,200 here, or see all listings above $779,200.
Market Activity — Vancouver West
Detached home new listings climbed to 239 in June 2026, up from 202 in May. Year-over-year, new house supply rose 9.2% compared to June 2025. Active inventory stands at 734 houses. Attached (Townhomes and Duplexes) eased to 198 new listings in June, down slightly from 207 in May. Year-over-year, however, new attached supply increased 14.6% compared to June 2025. Active inventory for townhouses stands at 328 units. Condo new listings fell to 640 in June, down from 729 in May. Furthermore, new condo supply dropped sharply — down 27.2% year-over-year from the 814 condos listed in June 2025. Active condo inventory stands at 1,721 units across Vancouver West.
House sales in Vancouver West reached 78 in June 2026, a 14.7% increase year-over-year from the 68 sales in June 2025. Subsequently, the sales-to-new-listings ratio (SNLR) for houses reached 32.6%, indicating buyer’s market conditions. The sales-to-active-listings ratio stood at 10.6%, below Metro Vancouver’s 12.0% baseline for houses. Attached home sales totalled 72 in June 2026, a 4.3% increase year-over-year from the 69 sales in June 2025. The attached homes SNLR of 36.4% continued to signal buyer’s market territory. Meanwhile, 51 townhouse sales against 328 active units produced a townhouse sales-to-active-listings ratio of 15.5%, below Metro Vancouver’s 17.8% townhouse baseline. Condo sales reached 269 in June 2026, a 3.9% decline year-over-year from the 280 sales in June 2025. The condo SNLR of 42.0% indicated balanced market conditions. Additionally, the condo sales-to-active-listings ratio of 15.6% closely matched Metro Vancouver’s 15.5% condo baseline.
- See houses with open houses in Vancouver West here
- Discover townhomes with open houses in Vancouver West
- Explore condos with open houses in Vancouver West
Metro Vancouver Market Context — June 2026
June 2026 saw demand pick up broadly across Metro Vancouver, with sales rising for detached, attached and apartment properties alike. According to Greater Vancouver REALTORS® (GVR), Andrew Lis noted: “June saw a pattern of broad gains in home sales across all home types relative to the same time last year, which has been a rare occurrence in recent years. June’s data could be an early sign of a shift in the market. In recent years, sales trends have usually been mixed across home types, which is typical of a sideways trending market. But with all housing types posting gains in June, the data indicate demand may be returning to the market more broadly.”
Furthermore, Lis observed that “despite signs that demand is slowly returning to the market, prices haven’t moved much in recent months as the inventory of homes for sale has been big enough to absorb the increased demand.” Additionally, he noted: “prices typically trend upwards when demand rises and inventory declines. With recent data revealing a slower pace of new listings coming to market, standing inventory is no longer climbing, and may be showing early signs of reversing.”
Metro Vancouver’s sales-to-active-listings ratios stood at 12.0% for houses, 17.8% for townhouses, and 15.5% for condos in June 2026. Vancouver East showed stronger house absorption, posting a 13.7% ratio above Metro’s 12.0% baseline. The Vancouver East townhouse ratio of 18.3% closely matched Metro’s 17.8% baseline. Meanwhile, Vancouver East condos outpaced the regional average, posting an 18.0% ratio above Metro’s 15.5% condo baseline. Vancouver West houses came in below the Metro detached baseline at 10.6%. The Vancouver West townhouse ratio of 15.5% also fell below Metro’s 17.8% baseline. However, Vancouver West condos closely matched the regional average, posting a 15.6% ratio against Metro’s 15.5% condo baseline.
Frequently Asked Questions — Vancouver Real Estate June 2026
Q: Are Vancouver home prices rising or falling in June 2026?
A:
Vancouver home prices showed mixed movement in June 2026. In Vancouver East, house benchmarks rose 0.3% month-over-month but remained down 9.6% year-over-year, while townhouses fell 1.1% monthly and 3.5% annually. Condos declined 0.5% monthly and 7.2% year-over-year. In Vancouver West, houses gained 0.6% month-over-month, though they stayed down 9.2% year-over-year. Townhouses rose 1.5% monthly but were still down 5.4% annually, while condos slipped 0.5% monthly and 5.6% year-over-year.
Q: Is it a good time to buy Vancouver real estate in June 2026?
A:
June 2026 conditions continue to favour buyers across most segments. Sales-to-new-listings ratios confirmed buyer’s market conditions in nearly every category, with Vancouver West condos the lone exception at a balanced 42.0% SNLR. Additionally, sales-to-active-listings ratios remain moderate. Vancouver East houses posted 13.7% and Vancouver West houses came in at 10.6% — both well below the 20% threshold that signals upward price pressure. Consequently, buyers in both cities continue to find solid selection and negotiating room.
Q: Which Vancouver area offers better real estate value in June 2026?
A:
Vancouver East offers stronger relative value across most property types. House benchmarks in Vancouver East ($1,659,400) are approximately $1,382,700 below Vancouver West ($3,042,100). Condos in Vancouver East ($637,300) are $141,900 more affordable than Vancouver West ($779,200). Furthermore, Vancouver East house and condo benchmarks remain below Metro Vancouver averages, reinforcing its position as one of the region’s more accessible markets. Vancouver West, however, recorded stronger house and attached home price momentum this month.
Q: How does Vancouver East compare to Vancouver West for real estate investment?
A:
Both cities remain largely in buyer’s market territory in June 2026, though their investment profiles differ. Vancouver East offers lower entry points, and condo absorption at 18.0% outpaces Metro Vancouver’s 15.5% baseline — suggesting steady demand relative to supply. Additionally, attached home sales rose 32.8% year-over-year in Vancouver East. Vancouver West, meanwhile, posted broad-based sales growth across all three property types, with house sales up 14.7% year-over-year. The ongoing 9.2% year-over-year price correction in Vancouver West houses may also represent a repricing opportunity for longer-term buyers.
Q: What are the best Vancouver communities to buy in June 2026?
A:
Both Vancouver East and Vancouver West offer opportunities in June 2026, depending on budget and property type. Vancouver East remains the value-focused choice — with house and condo benchmarks below Metro Vancouver averages and above-regional condo absorption. Specifically, condo buyers benefit from 594 active listings and a moderate sales pace. Vancouver West suits buyers targeting premium houses and attached homes, where sales momentum picked up broadly this month. Additionally, Vancouver West condo absorption at 15.6% closely tracked Metro’s baseline in June 2026, suggesting steady buyer interest in that segment.
Meet Your Presale and Assignment Experts
Not every real estate agent specializes in presales and assignments. Contracts, deposit structures and developer negotiations work differently from resale, so it pays to work with REALTORS® who do this every day.
Talk to a Presale Specialist


Featured Buildings