North Shore real estate in April 2026 presented a divergent picture across North Vancouver and West Vancouver. Year-over-year price declines persisted across all property types in both cities. However, North Vancouver’s monthly benchmarks advanced in all three property types — signalling a degree of price resilience. Meanwhile, West Vancouver recorded steep month-over-month corrections in both houses and condos, even as detached sales activity improved meaningfully year-over-year.
North Vancouver Real Estate — April 2026
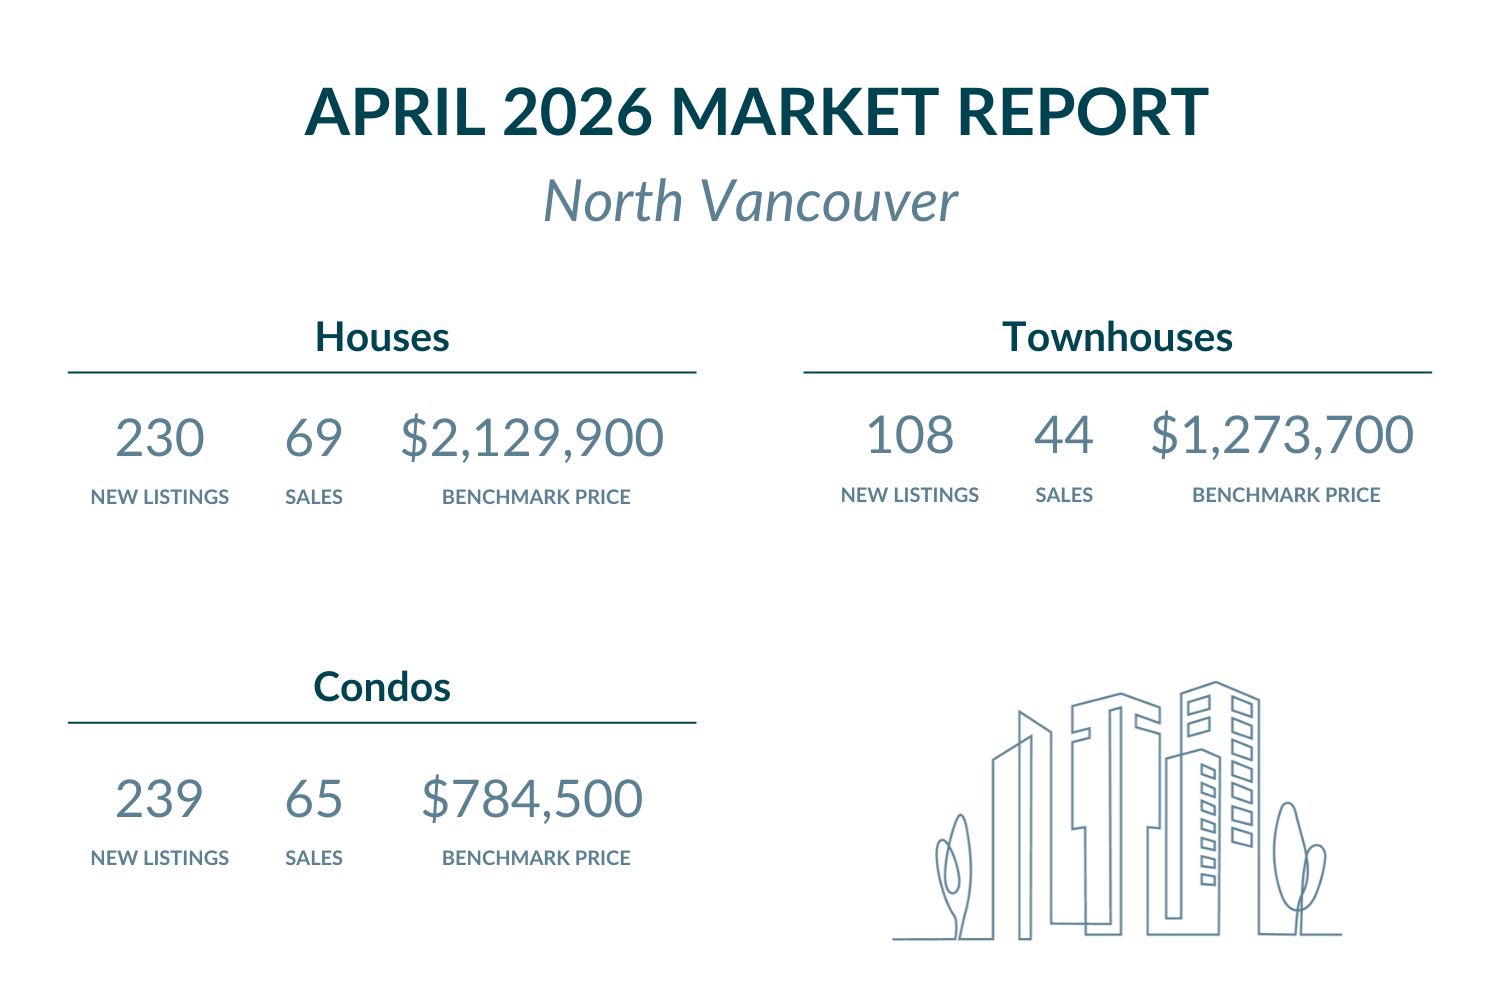
North Vancouver produced mixed results in April 2026, with townhouse sales surging 33.3% year-over-year while condo sales declined sharply. Nevertheless, all three benchmark prices posted modest monthly gains. Furthermore, house sales edged lower year-over-year — though the detached segment retained strong absorption relative to Metro Vancouver.
Price Analysis — North Vancouver
North Vancouver Houses:
The benchmark price for houses in North Vancouver reached $2,129,900 in April 2026, a 0.7% increase from March 2026. Year-over-year, however, the benchmark declined 2.8% compared to April 2025. Furthermore, Metro Vancouver’s house benchmark stood at $1,840,700 in April 2026, placing North Vancouver approximately $289,200 above the regional average. This premium reflects the city’s desirable location, access to outdoor amenities, and limited land supply along the North Shore.
Browse North Vancouver houses listed under $2,129,900 here, or explore available options above $2,129,900.
North Vancouver Townhouses:
The townhouse benchmark in North Vancouver reached $1,273,700 in April 2026, a 1.4% month-over-month gain. Year-over-year, prices declined 3.9% compared to April 2025. Additionally, Metro Vancouver’s townhouse benchmark of $1,043,400 places North Vancouver townhouses at a premium of approximately $230,300 above the regional average. Consequently, buyers entering this city’s townhouse market pay a meaningful premium over Metro Vancouver standards.
Search North Vancouver townhomes priced under $1,273,700 here, or view options above $1,273,700.
North Vancouver Condos:
The condo benchmark in North Vancouver reached $784,500 in April 2026, a 0.6% month-over-month gain. Year-over-year, the benchmark declined 4.0% from April 2025. Moreover, Metro Vancouver’s condo benchmark of $703,000 places North Vancouver condos approximately $81,500 above the regional average. Specifically, this moderate premium makes North Vancouver condos more accessible relative to Metro standards than either houses or townhouses in this city.
Find North Vancouver condos listed under $784,500 here, or see all condos priced above $784,500.
Market Activity — North Vancouver
Detached home listings rose to 230 in April 2026, up from 147 in March. Year-over-year, however, new house supply declined 7.8% compared to the 248 houses listed in April 2025. Active inventory stands at 401 houses. Townhouse listings slipped to 108 in April, down slightly from 110 in March. Year-over-year, new townhouse supply fell 4.6% compared to the 113 townhouses listed in April 2025. Active inventory stands at 156 townhomes. Condo listings reached 239 in April, nearly unchanged from 240 in March. Additionally, new condo supply declined 11.7% year-over-year compared to the 267 condos listed in April 2025. Active inventory for condos stood at 464 units.
House sales in North Vancouver totalled 69 in April 2026, a 5.5% decline year-over-year from the 73 sales recorded in April 2025. Subsequently, the sales-to-new-listings ratio (SNLR) reached 30.0%, signalling buyer’s market conditions. The sales-to-active-listings ratio for houses stood at 17.2%, above Metro Vancouver’s 11.3% baseline for detached homes. Townhouse sales rose to 44 in April 2026, a 33.3% increase year-over-year from the 33 sales in April 2025. Furthermore, the townhouse SNLR of 40.7% indicated balanced market conditions. The sales-to-active-listings ratio for townhouses reached 24.4%, significantly exceeding Metro Vancouver’s 15.0% townhouse baseline. Condo sales totalled 65 in April 2026, a 32.3% decline year-over-year from the 96 sales in April 2025, with an SNLR of 27.2%. The condo sales-to-active-listings ratio reached 14.4%, closely matching Metro Vancouver’s 14.7% condo baseline.
- Check houses with open houses in North Vancouver here
- Browse townhomes with open houses in North Vancouver
- Find condos with open houses in North Vancouver
West Vancouver Real Estate — April 2026
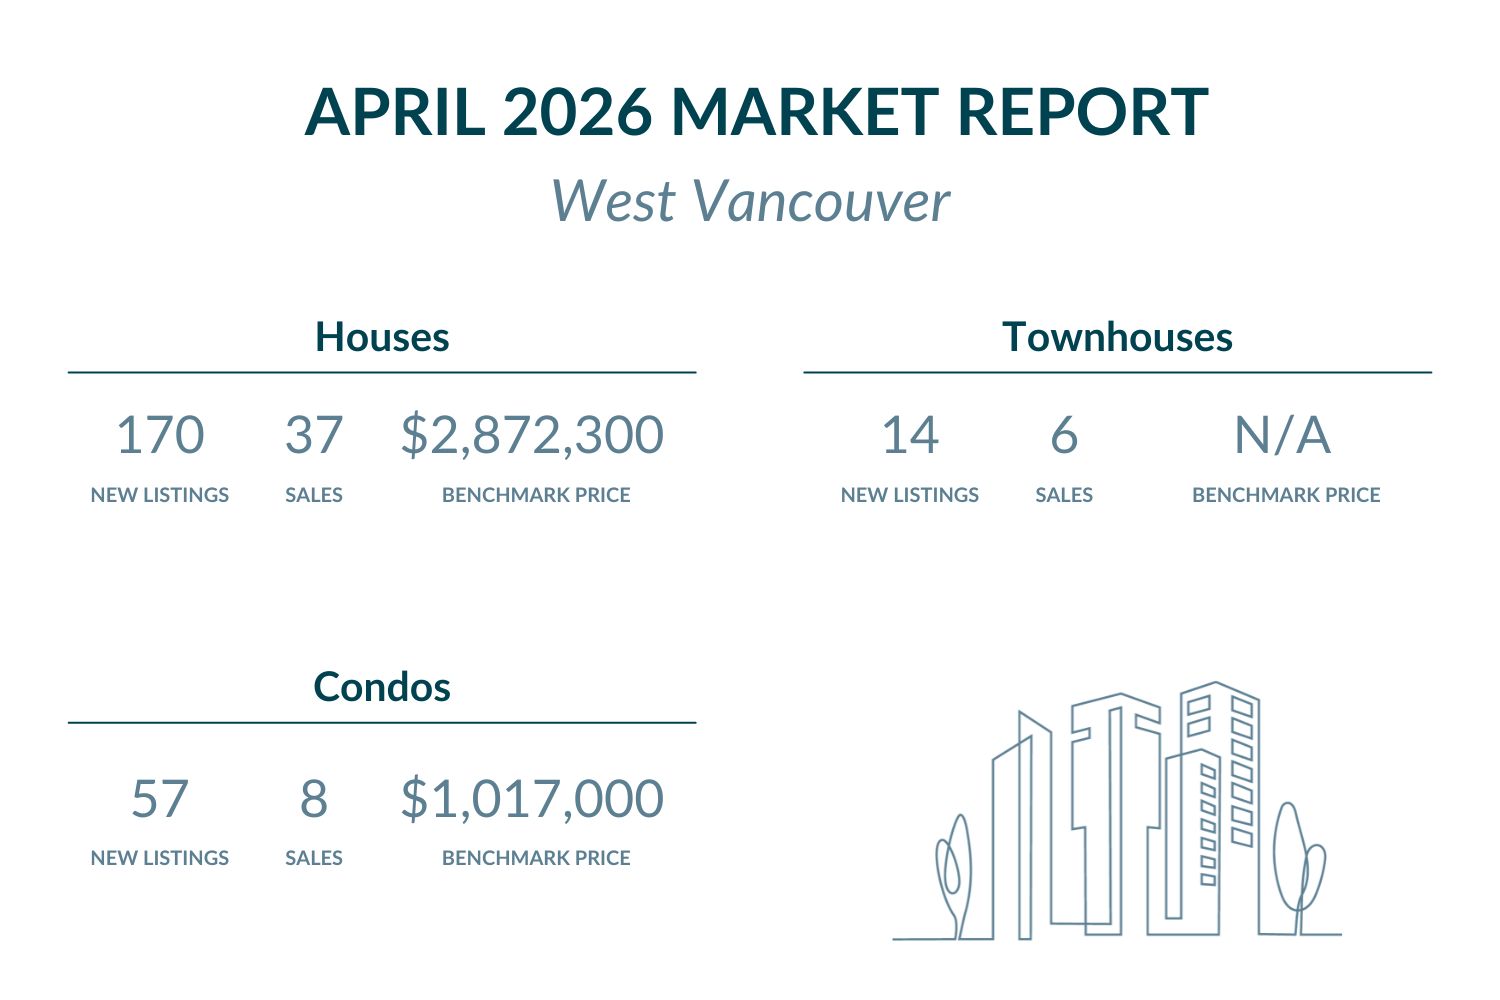
West Vancouver recorded some of the steepest price corrections across both North Shore cities in April 2026. House and condo benchmarks fell both monthly and annually, with the condo segment posting a 15.0% year-over-year decline. Nevertheless, house sales activity surged 42.3% year-over-year, suggesting continued — if measured — demand at the premium end of the market.
Price Analysis — West Vancouver
West Vancouver Houses:
The benchmark price for houses in West Vancouver reached $2,872,300 in April 2026, a 7.2% decline from March 2026. Year-over-year, the benchmark fell 13.6% compared to April 2025. Compared to Metro Vancouver’s house benchmark of $1,840,700, West Vancouver houses carry a premium of approximately $1,031,600. This places them substantially above the regional standard, reflecting the city’s exclusive positioning at the top of Metro Vancouver’s market — even as prices adjust from prior peak levels.
Browse West Vancouver houses listed under $2,872,300 here, or discover available homes above $2,872,300.
West Vancouver Condos:
The condo benchmark in West Vancouver reached $1,017,000 in April 2026, an 8.5% month-over-month decline. Year-over-year, the benchmark fell 15.0% from April 2025 — the steepest annual correction across both North Shore cities. Furthermore, Metro Vancouver’s condo benchmark of $703,000 places West Vancouver condos at a premium of approximately $314,000 above the regional average. As a result, this remains one of the most premium condo markets in Metro Vancouver, though the ongoing correction has meaningfully narrowed that gap from prior levels.
Find West Vancouver condos listed under $1,017,000 here, or see all listings above $1,017,000.
Market Activity — West Vancouver
Detached home listings reached 170 in April 2026, up from 138 in March. Year-over-year, however, new house supply declined 16.5% compared to the 198 houses listed in April 2025. Active inventory stands at 475 houses. Townhouse listings rose to 16 in April, up from 14 in March — an 18.8% increase year-over-year from the 13 townhouses listed in April 2025. Active inventory stands at 28 townhomes. Condo listings held steady at 57 in April, unchanged from March. Additionally, new condo supply declined 8.8% year-over-year compared to the 62 condos listed in April 2025. Active inventory for condos stood at 139 units.
House sales in West Vancouver reached 37 in April 2026, a 42.3% increase year-over-year from the 26 sales recorded in April 2025. Subsequently, the sales-to-new-listings ratio (SNLR) reached 21.8%, indicating buyer’s market conditions. The sales-to-active-listings ratio for houses stood at 8.0%, below Metro Vancouver’s 11.3% baseline for detached homes. Townhouse sales totalled 6 in April 2026, up from 1 sale recorded in April 2025 — though this reflects an extremely thin segment where individual transactions produce large percentage swings. The townhouse SNLR of 37.5% remained in buyer’s market territory. Furthermore, the sales-to-active-listings ratio for townhouses reached 17.9%, above Metro Vancouver’s 15.0% townhouse baseline. Condo sales reached 8 in April 2026, a 20.0% decline year-over-year from the 10 sales in April 2025, with an SNLR of 14.0%. The condo sales-to-active-listings ratio stood at 8.6%, well below Metro Vancouver’s 14.7% condo baseline.
- See houses with open houses in West Vancouver here
- Explore condos with open houses in West Vancouver
Metro Vancouver Market Context — April 2026
April 2026 continued the pattern of divergence between Metro Vancouver’s detached and multi-family segments. According to Greater Vancouver REALTORS® (GVR), Andrew Lis noted that “sales of detached homes have been gaining year-over-year,” while sales in the multi-family segment have declined — a pattern consistent across most areas of Metro Vancouver. Furthermore, Lis observed that this broad-based momentum in the detached segment reduces the likelihood it is simply an isolated blip. Additionally, he noted that prices across all segments remain relatively flat month-over-month, as inventory levels remain sufficient to keep price escalation at bay.
Metro Vancouver’s sales-to-active-listings ratios in April 2026 stood at 11.3% for detached homes, 15.0% for townhouses, and 14.7% for condos. North Vancouver recorded absorption above regional averages in both the detached and townhouse segments. Houses posted a ratio of 17.2%, above Metro’s 11.3% baseline. The townhouse ratio of 24.4% significantly exceeded Metro’s 15.0% benchmark. However, condo absorption at 14.4% closely matched Metro’s 14.7% condo baseline. Meanwhile, West Vancouver recorded the opposite dynamic across most segments. The house ratio of 8.0% fell below Metro’s 11.3% detached benchmark. The townhouse sales-to-active-listings ratio reached 17.9%, above Metro’s 15.0% townhouse baseline. However, condo absorption at 8.6% fell well below Metro’s 14.7% condo baseline — consistent with West Vancouver’s characteristically measured luxury market.
Frequently Asked Questions — North Shore Real Estate April 2026
Q: Are North Shore home prices rising or falling in April 2026?
A:
North Shore home prices are declining year-over-year across both cities, though monthly trends diverged sharply. North Vancouver posted modest monthly gains across all three property types — houses up 0.7%, townhouses up 1.4%, and condos up 0.6%. West Vancouver moved in the opposite direction, with houses falling 7.2% and condos dropping 8.5% month-over-month. Year-over-year, declines ranged from -2.8% for North Vancouver houses to -15.0% for West Vancouver condos.
Q: Is it a good time to buy North Shore real estate in April 2026?
A:
April 2026 conditions broadly favour buyers across the North Shore. Sales-to-new-listings ratios fell below 40% in most segments across both cities, confirming buyer’s market conditions throughout — with North Vancouver townhouses the sole exception at a balanced 40.7%. Furthermore, North Vancouver’s sales-to-active-listings ratios — 17.2% for houses and 24.4% for townhouses — reflect healthy demand without triggering upward price pressure. West Vancouver ratios are more subdued, with houses at 8.0% and condos at 8.6% — both well below Metro averages. Townhouse absorption, however, reached 17.9%, above Metro’s 15.0% baseline. Consequently, buyers across both cities benefit from meaningful negotiating leverage and solid inventory selection.
Q: Which North Shore city offers better real estate value in April 2026?
A:
North Vancouver offers stronger relative value across all property types. House benchmarks in North Vancouver ($2,129,900) sit approximately $742,400 below West Vancouver ($2,872,300). North Vancouver condos ($784,500) are $232,500 more affordable than West Vancouver condos ($1,017,000). Furthermore, North Vancouver’s higher sales volumes and stronger absorption ratios across all segments suggest more active and liquid market conditions — an important consideration for buyers with future resale in mind.
Q: How does North Vancouver compare to West Vancouver for real estate investment?
A:
Both cities recorded year-over-year price declines in April 2026, though with notably different dynamics. North Vancouver offers lower entry prices with stronger overall absorption — townhouse sales surged 33.3% year-over-year, and the sales-to-active-listings ratio of 24.4% substantially exceeded Metro Vancouver’s baseline for that property type. West Vancouver, meanwhile, saw the steepest price corrections of both cities: house benchmarks fell 13.6% year-over-year and condos declined 15.0%. However, the 42.3% year-over-year gain in West Vancouver house sales may signal that motivated buyers are finding value at current adjusted price levels — a potential indicator of a repricing floor forming in the detached segment.
Q: What are the best North Shore communities to buy in April 2026?
A:
Both North Vancouver and West Vancouver offer buying opportunities in April 2026, depending on budget and goals. North Vancouver suits buyers seeking condos or townhouses with stronger market liquidity. Specifically, North Vancouver townhouses — benchmarked at $1,273,700 with a 1.4% monthly gain and a 33.3% year-over-year sales increase — represent a compelling entry point with demonstrated demand. West Vancouver appeals to buyers targeting premium single-family houses, where the 13.6% year-over-year price correction has introduced meaningful adjustments from prior peak levels. Additionally, West Vancouver’s reduced condo prices — down 15.0% annually — may attract buyers seeking high-end attached product at a relative discount from recent highs.
Featured Buildings


