North Shore Real Estate January 2026 | North Vancouver & West Vancouver Market
Written by Colin Gatward
North Shore real estate January 2026 reflected the broader market reality as subdued activity persisted into the new year. Subsequently, both North Vancouver and West Vancouver demonstrated buyer-favorable conditions with elevated inventory levels. Moreover, sales volumes declined significantly compared to January 2025. As a result, both communities maintained pricing pressures amid limited buyer urgency.
North Vancouver Real Estate January 2026 – Modest Resilience Amid Soft Demand
North Vancouver real estate market showed modest stability throughout January 2026. Therefore, this created opportunities for selective buyers across various price points.
North Vancouver Housing Market Price Analysis:
North Vancouver Detached Homes / Houses:
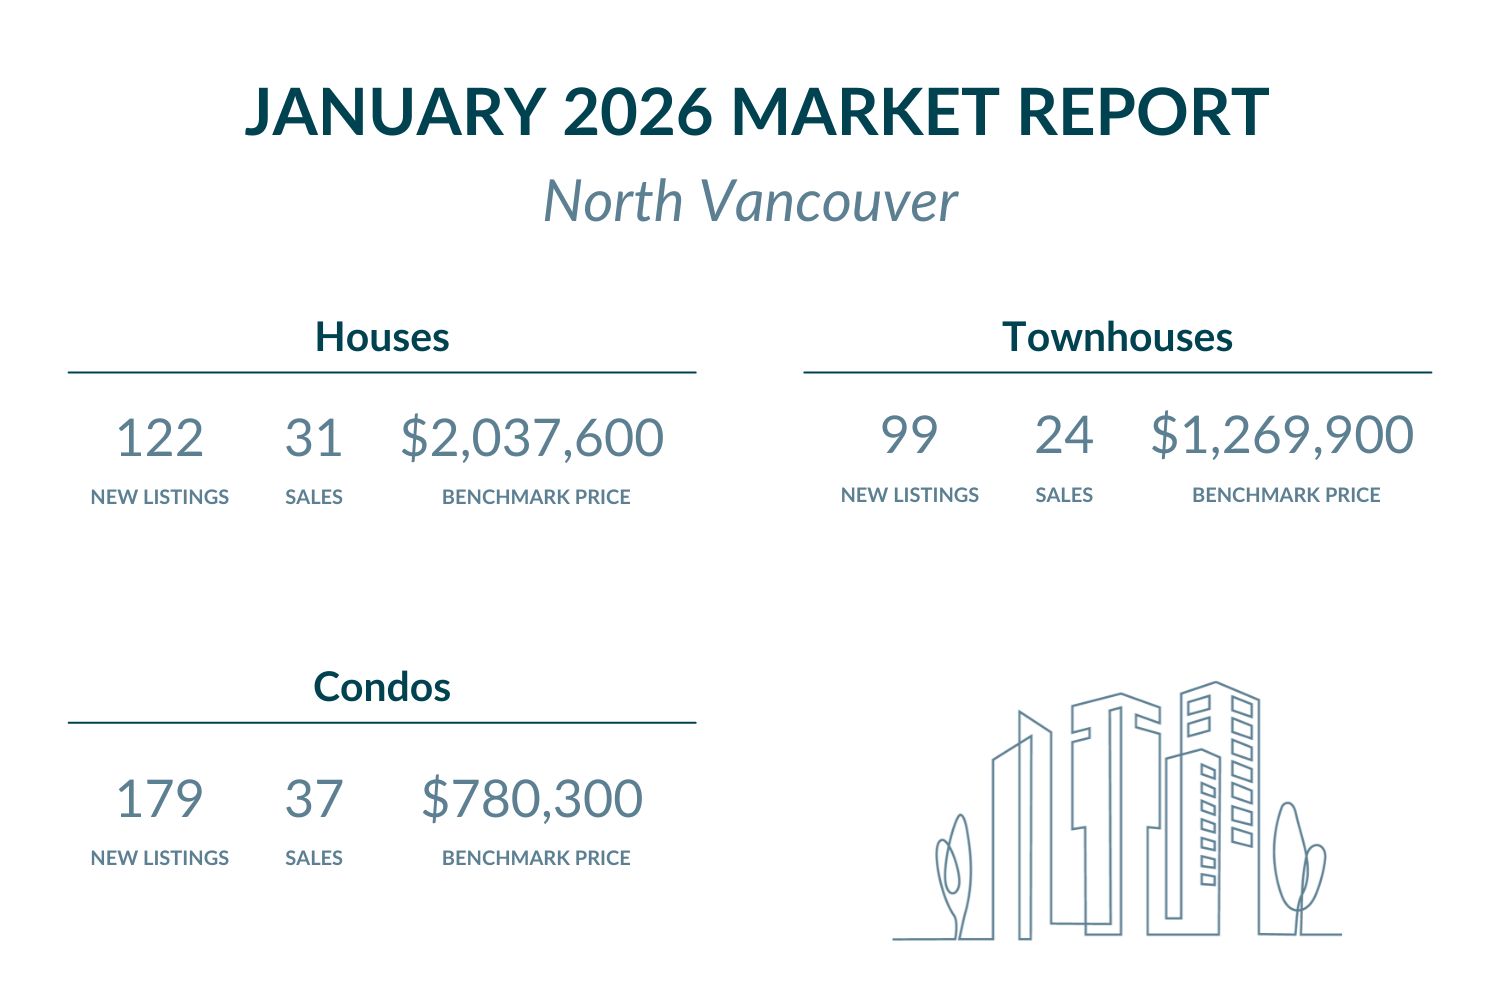
The benchmark price declined marginally by 0.2% month-over-month to $2,037,600. Furthermore, this represents a 6.9% decrease compared to January 2025. Currently, North Vancouver substantially exceeds Metro Vancouver’s benchmark of $1,850,800. Specifically, this commands approximately $186,800 premium above regional averages.
Browse North Vancouver detached homes under $2,040,000 here, or explore available options above $2,040,000.
North Vancouver Townhouses / Attached Homes:
Townhouse prices increased 1.0% from December to $1,269,900. However, year-over-year prices dropped 7.5% from January 2025. Currently, North Vancouver significantly exceeds Metro Vancouver’s benchmark of $1,043,400. As a result, this represents approximately $226,500 premium above regional standards.
Explore North Vancouver townhomes listed below $1,270,000 here, or check out exclusive properties above $1,270,000.
North Vancouver Condos / Apartments:
Condo prices increased 0.6% from December to $780,300. Additionally, year-over-year prices declined only 0.8% compared to January 2025. Currently, North Vancouver remains above Metro Vancouver’s benchmark of $704,600. Moreover, this provides approximately $75,700 premium over regional averages.
Search North Vancouver condos priced below $780,000 here, or view high-end listings above $780,000.
North Vancouver Real Estate Market Activity:
New listings showed mixed results across different property types. Detached home listings reached 122 in January, down from December’s 32. Meanwhile, this represented a 4.9% year-over-year decrease. Currently, active inventory stands at 232 detached homes. Townhouse listings totaled 99, up from December’s 21. Nevertheless, this marked a solid 22.2% increase year-over-year. Condo listings reached 179, up from December’s 56, showing a 21.2% year-over-year decline. Active inventory stands at 396 combined townhouses and condos.
Sales activity showed balanced to buyer-favorable performance across property segments. Detached home sales totaled 31 with a 25.4% sales-to-new-listings ratio, indicating buyer’s market conditions leaning toward balance. Additionally, the sales-to-active-listings ratio reached 13.4%, significantly exceeding Metro Vancouver’s 6.7% baseline. Townhouse sales reached 24, producing a 24.2% sales-to-new-listings ratio, reflecting buyer’s market conditions with enhanced negotiating power. Condo sales totaled 37, yielding a 20.7% sales-to-new-listings ratio, suggesting buyer’s market conditions. Furthermore, the combined sales-to-active-listings ratio achieved 14.4%, exceeding Metro Vancouver’s 11.1% for townhouses and 10.3% for condos. These ratios indicate modest absorption relative to available supply in North Vancouver.
- Discover all North Vancouver detached homes with upcoming open houses here.
- Find North Vancouver townhouses hosting open houses here.
- Check out all North Vancouver condos with open houses coming up here.
West Vancouver Real Estate January 2026 – Luxury Market Faces Significant Headwinds
West Vancouver real estate market experienced pronounced adjustment throughout January 2026. Consequently, this reflected the challenges facing ultra-premium properties amid limited buyer activity.
West Vancouver Housing Market Price Analysis:
West Vancouver Detached Homes / Houses:
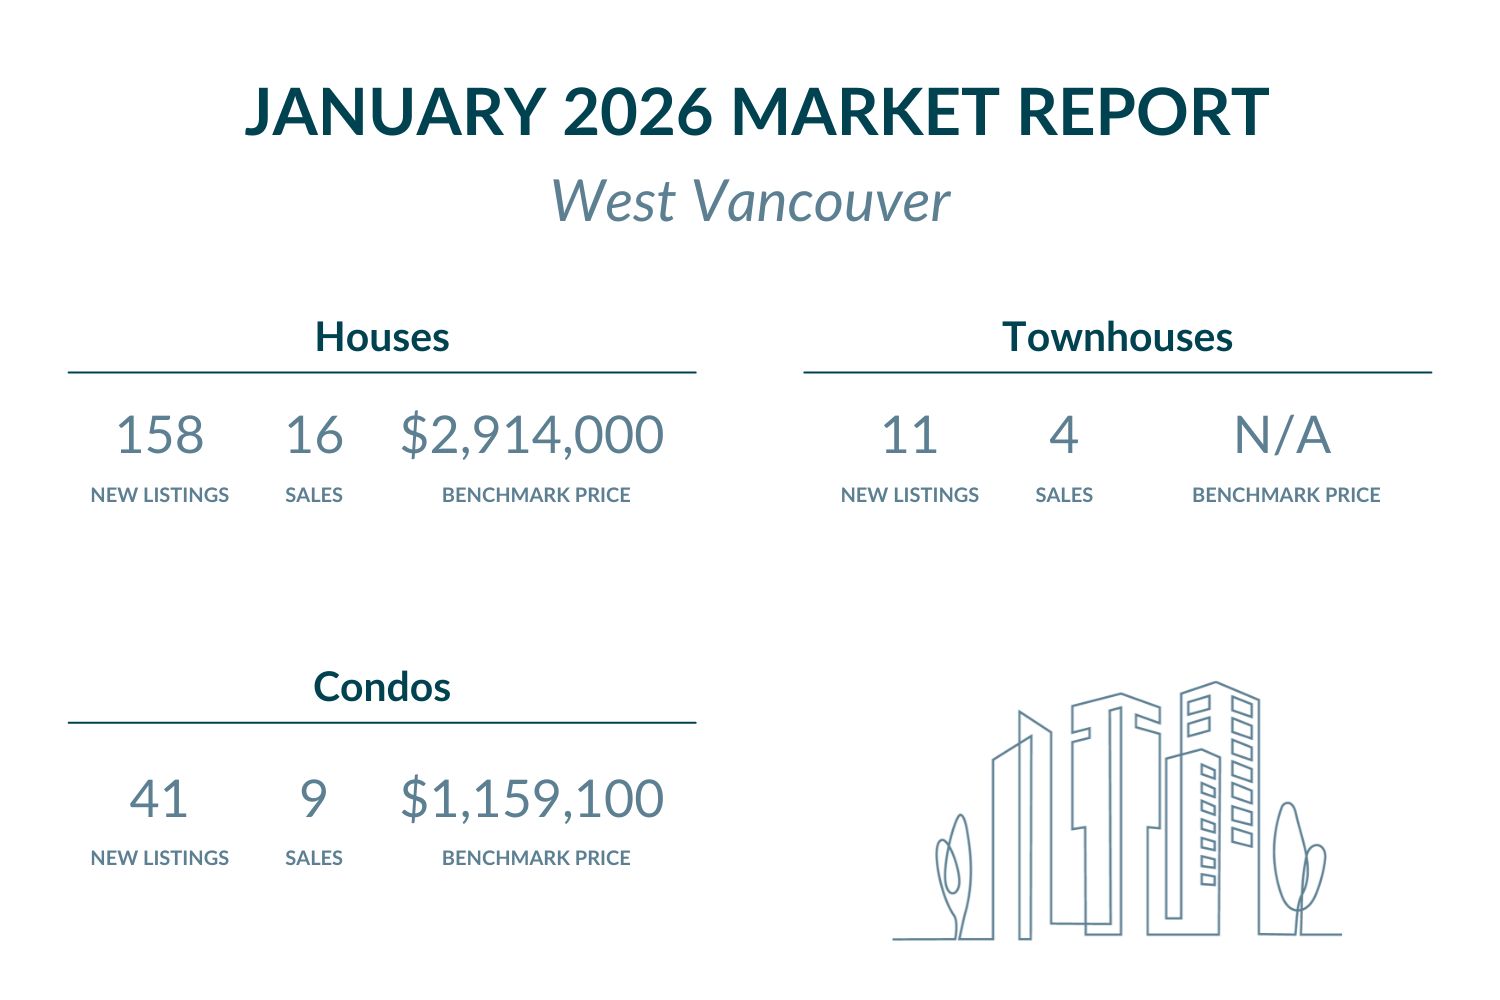
The benchmark price declined sharply by 5.1% month-over-month to $2,914,000. However, year-over-year prices decreased 8.2% from January 2025. Currently, West Vancouver dramatically exceeds Metro Vancouver’s benchmark of $1,850,800. Moreover, this commands a substantial premium of approximately $1,063,200.
Browse West Vancouver detached homes listed under $2,920,000 here, or explore upscale options above $2,920,000.
West Vancouver Townhouses / Attached Homes:
Townhouse data remained unavailable for benchmark pricing due to minimal market activity. West Vancouver townhouse inventory remains extremely limited with insufficient transactions for reliable benchmark assessment.
West Vancouver Condos / Apartments:
Condo prices increased 7.6% from December to $1,159,100. Additionally, year-over-year prices fell 1.4% from January 2025. Currently, West Vancouver substantially exceeds Metro Vancouver’s benchmark of $704,600. Therefore, this represents approximately $454,500 premium over regional averages.
View West Vancouver condos listed below $1,160,000 here, or check out high-end selections above $1,160,000.
West Vancouver Real Estate Market Activity:
New listings displayed varied trends across property segments. Detached home new listings increased to 158 from December’s 40. Meanwhile, this marked a strong 19.0% increase year-over-year. Currently, active inventory stands at 388 detached homes. Townhouse new listings reached 11, down from December’s 6. Nevertheless, this reflected minimal market activity year-over-year. Condo new listings totaled 41, up from December’s 13, representing a 4.9% increase year-over-year. Active inventory stands at 120 combined condos and townhouses.
Sales activity showed deep buyer’s market dynamics across all property types. Detached home sales totaled 16 with a 10.1% sales-to-new-listings ratio, indicating pronounced buyer’s market conditions with substantial negotiating leverage. Additionally, the sales-to-active-listings ratio reached 3.9%, significantly below Metro Vancouver’s 6.7% baseline. Townhouse sales reached 4, producing a 36.4% sales-to-new-listings ratio, reflecting balanced conditions with slight buyer advantage given minimal supply. Condo sales totaled 9, yielding a 22.0% sales-to-new-listings ratio, suggesting buyer’s market conditions. Furthermore, the combined townhouse and condo sales-to-active-listings ratio achieved 9.2%, below Metro Vancouver’s 11.1% for townhouses and slightly above the 10.3% for condos. These ratios demonstrate significant market softness in West Vancouver’s luxury segment.
- Discover all West Vancouver detached homes with upcoming open houses here.
- Check out West Vancouver condos with open houses coming up here.
Metro Vancouver Market Context – North Shore Reflects Broader Softness
January 2026 confirmed the continuation of subdued market conditions that characterized late 2025. Metro Vancouver’s sales-to-active-listings ratios stood at 6.7% for detached homes, 11.1% for townhouses, and 10.3% for condos. North Vancouver showed slightly stronger absorption compared to these benchmarks, with houses achieving 13.4% (exceeding Metro by 6.7 points), and combined multi-family at 14.4% (exceeding Metro’s townhouse 11.1% and condo 10.3%). Meanwhile, West Vancouver recorded significantly softer results with houses at 3.9% (2.8 points below Metro), and combined multi-family at 9.2% (below Metro’s townhouse baseline).
The standout challenge was West Vancouver detached homes, reflecting particularly weak demand relative to available inventory in the ultra-luxury segment. North Vancouver demonstrated modest resilience with slightly better absorption rates, though still operating firmly in buyer’s market territory. Therefore, both North Shore communities continue facing elevated inventory levels and subdued competition as the market slowly evolves toward what may represent a new normal for 2026.
Frequently Asked Questions – North Shore Real Estate January 2026
Q: Are North Shore home prices rising or falling in January 2026?
A: North Shore prices showed mixed movement in January 2026. North Vancouver houses declined 0.2% monthly while townhouses rose 1.0% and condos increased 0.6%. West Vancouver saw houses drop 5.1% and condos climb 7.6%, reflecting pronounced adjustment in the luxury segment.
Q: Is it a good time to buy North Shore real estate in January 2026?
A: January 2026 presents favorable buying conditions with strong buyer leverage. North Vancouver shows sales-to-active-listings ratios of 13.4% to 14.4%, while West Vancouver demonstrates 3.9% to 9.2% ratios. These buyer’s market conditions provide enhanced negotiating power, particularly in West Vancouver’s luxury segment.
Q: Which North Shore area offers better real estate value in January 2026?
A: North Vancouver provides superior relative value with houses at $2.0M versus West Vancouver’s $2.9M. Additionally, North Vancouver prices remain more stable with modest monthly declines, while showing slightly stronger absorption at 13.4%-14.4% sales-to-active-listings ratios.
Q: How does North Vancouver compare to West Vancouver for real estate investment?
A: North Vancouver shows modestly better fundamentals with 13.4% house absorption and 14.4% multi-family absorption, exceeding Metro Vancouver baselines. West Vancouver offers deeper luxury market opportunities with houses at 3.9% absorption providing maximum negotiating leverage for ultra-premium purchasers.
Q: What are the best North Shore communities to buy in January 2026?
A: Both North Vancouver and West Vancouver offer distinct advantages. North Vancouver provides relatively stable pricing with modest absorption above Metro averages, while West Vancouver delivers exceptional buyer leverage in the luxury market with significantly below-market sales ratios for detached homes.
Featured Buildings


