North Shore Real Estate November 2025 | North Vancouver & West Vancouver Market
Written by Lynn Le Drew
In November 2025, North Shore real estate demonstrated divergent market dynamics between the two municipalities as the year approached its conclusion. Subsequently, North Vancouver maintained relatively balanced conditions with steady transaction activity. Meanwhile, West Vancouver continued experiencing subdued demand particularly in the detached segment. As a result, both communities reflected the broader Metro Vancouver trend of patient buyers and adjusting seller expectations.
North Vancouver Real Estate November 2025 – Balanced Market Conditions Persist
North Vancouver real estate market showed resilient performance throughout November 2025. Therefore, this created balanced opportunities across most property segments.
North Vancouver Housing Market Price Analysis:
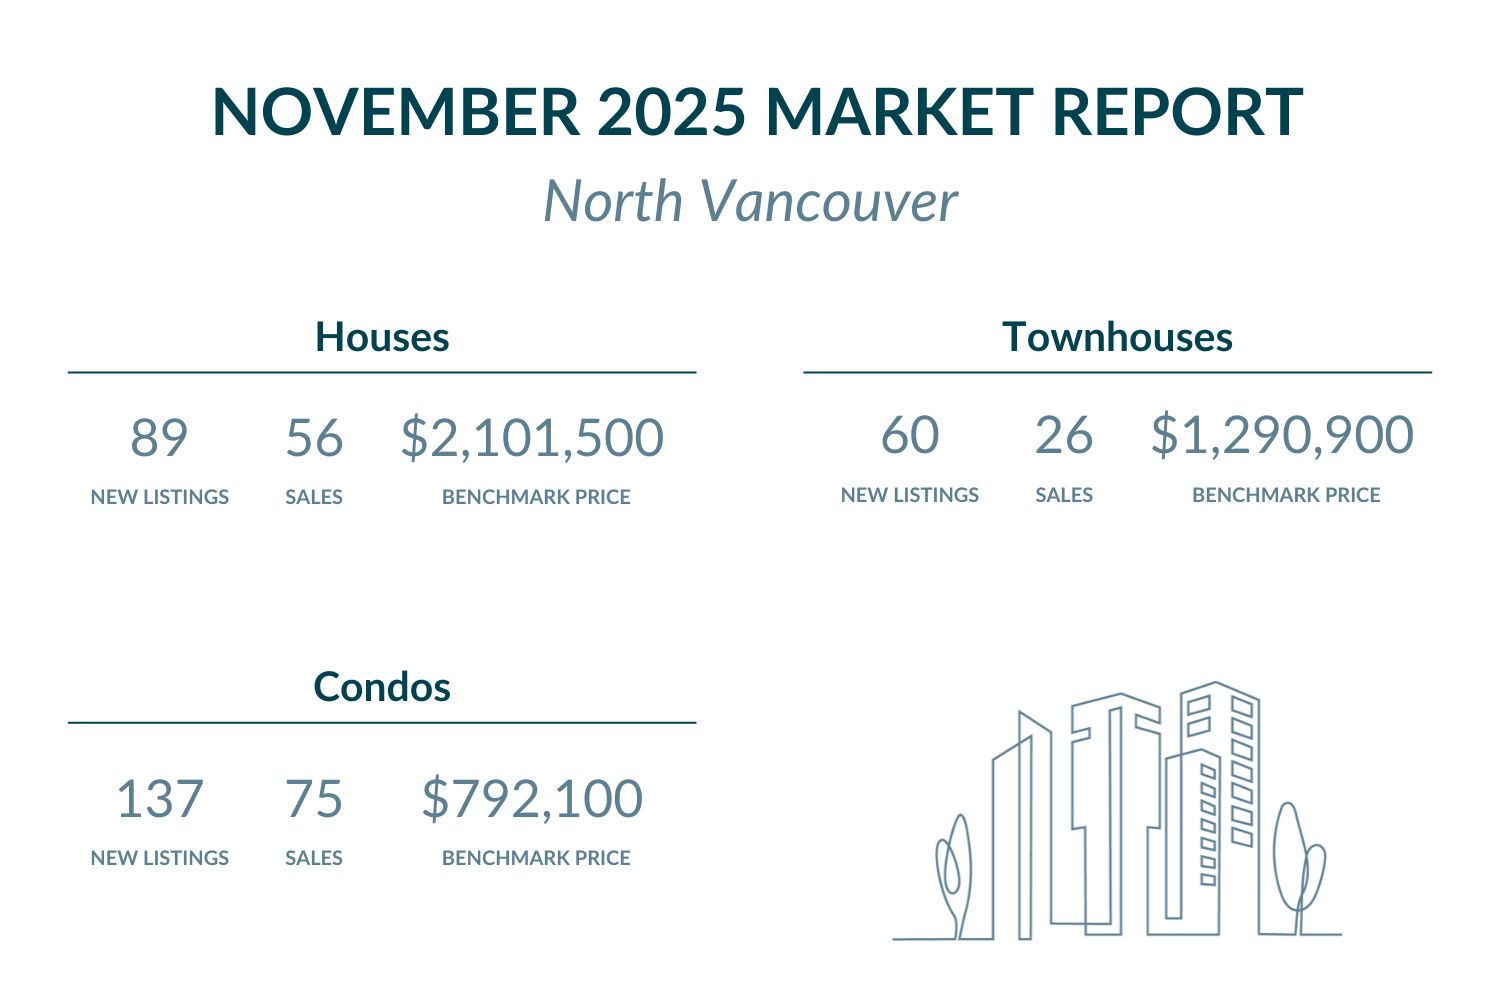
North Vancouver Detached Homes / Houses:
The benchmark price declined 0.2% month-over-month to $2,101,500. Furthermore, this represents a 1.7% decrease compared to November 2024. Currently, North Vancouver exceeds Metro Vancouver’s benchmark of $1,900,600. Specifically, this commands approximately $200,900 premium above regional averages.
Browse North Vancouver detached homes under $2,105,000 here, or explore available options above $2,105,000.
North Vancouver Townhouses / Attached Homes:
Townhouse prices declined 0.5% from October to $1,290,900. Additionally, year-over-year prices dropped 4.6% from November 2024. Currently, North Vancouver substantially exceeds Metro Vancouver’s benchmark of $1,065,600. As a result, this commands approximately $225,300 premium above regional standards.
Explore North Vancouver townhomes listed below $1,295,000 here, or check out exclusive properties above $1,295,000.
North Vancouver Condos / Apartments:
Condo prices increased 1.1% from October to $792,100. However, prices declined 0.7% compared to November 2024. Currently, North Vancouver remains above Metro Vancouver’s benchmark of $714,300. Moreover, this represents approximately $77,800 premium over regional averages.
Search North Vancouver condos priced below $795,000 here, or view high-end listings above $795,000.
North Vancouver Real Estate Market Activity:
New listings showed positive momentum across different property types. Detached home listings totaled 89 in November, down from October’s 152. Meanwhile, this represented a 6.7% year-over-year increase. Active inventory stood at 291 detached homes. Townhouse listings reached 60, down from October’s 94. Nevertheless, this marked a solid 28.3% increase year-over-year. Condo listings totaled 137, down from October’s 176, showing a 4.4% year-over-year increase. Active inventory for townhouses and condos combined stood at 488 units.
Sales activity showed resilient performance across all property segments. Detached home sales totaled 56 with a 62.9% sales-to-new-listings ratio, indicating seller’s market conditions with strong demand. Additionally, the sales-to-active-listings ratio reached 19.2%, nearly double Metro Vancouver’s 9.7% baseline. Townhouse sales reached 26, producing a 43.3% sales-to-new-listings ratio, reflecting balanced conditions with slight buyer advantage. Condo sales totaled 75, yielding a 54.7% sales-to-new-listings ratio, suggesting balanced market conditions. Furthermore, the combined sales-to-active-listings ratio for townhouses and condos achieved 19.9%, exceeding both Metro Vancouver’s townhouse baseline of 13.6% and condo baseline of 14.8%. These ratios indicate healthy demand across all property types, with particularly strong absorption in the detached segment demonstrating North Vancouver’s sustained appeal.
Take a look at all the detached homes in North Vancouver with an open house coming up here.
West Vancouver Real Estate November 2025 – Premium Market Shows Subdued Demand
West Vancouver real estate market maintained ultra-premium positioning while demonstrating subdued demand throughout November 2025. Consequently, this created buyer-favorable conditions particularly in the luxury detached segment.
West Vancouver Housing Market Price Analysis:
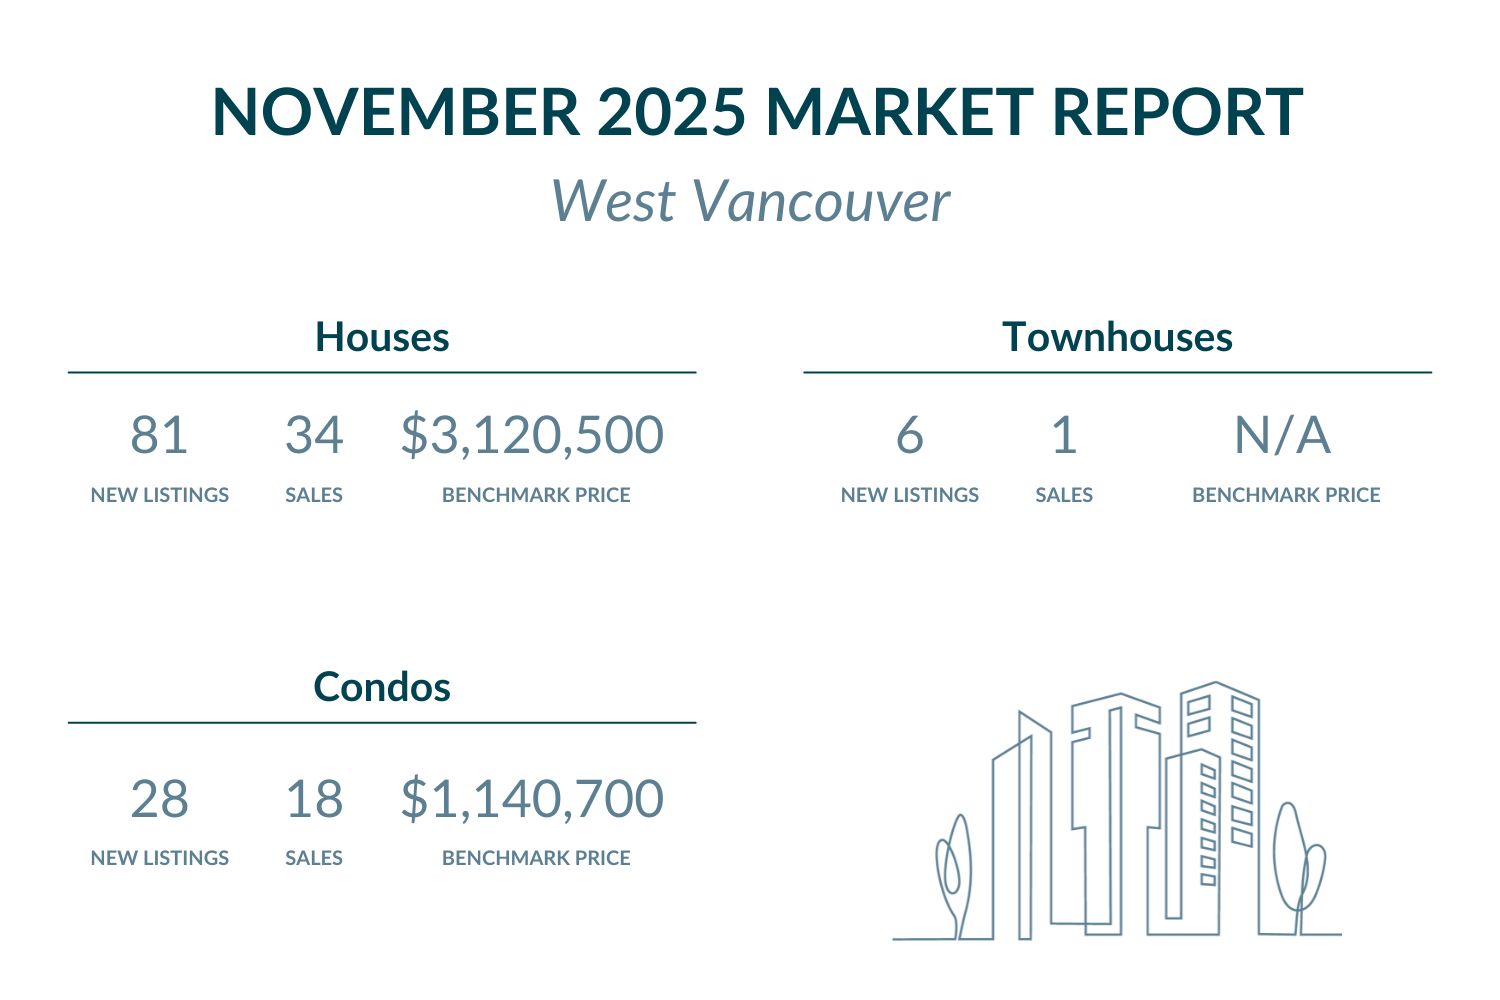
West Vancouver Detached Homes / Houses:
The benchmark price increased 1.0% month-over-month to $3,120,500. However, year-over-year prices decreased 2.7% from November 2024. Currently, West Vancouver dramatically exceeds Metro Vancouver’s benchmark of $1,900,600. Moreover, this commands a substantial premium of approximately $1,219,900.
Browse West Vancouver detached homes listed under $3,125,000 here, or explore upscale options above $3,125,000.
West Vancouver Condos / Apartments:
Condo prices increased 4.3% from October to $1,140,700. However, year-over-year prices fell 4.7% from November 2024. Currently, West Vancouver substantially exceeds Metro Vancouver’s benchmark of $714,300. Therefore, this represents approximately $426,400 premium over regional averages.
View West Vancouver condos listed below $1,145,000 here, or check out high-end selections above $1,145,000.
West Vancouver Real Estate Market Activity:
New listings displayed minimal activity across property segments. Detached home new listings decreased to 81 from October’s 160. Meanwhile, this marked a 3.7% increase year-over-year. Active inventory stood at 473 detached homes. Townhouse new listings reached only 6, down from October’s 24, reflecting limited market activity in this segment. Condo new listings totaled 28, down from October’s 36, remaining flat year-over-year. Active inventory for condos and townhouses combined stood at 137 units.
Sales activity showed subdued market dynamics across property types. Detached home sales totaled 34 with a 42.0% sales-to-new-listings ratio, indicating balanced market conditions with slight buyer advantage. Additionally, the sales-to-active-listings ratio reached 7.2%, significantly below Metro Vancouver’s 9.7% baseline. Townhouse sales reached only 1, producing a 16.7% sales-to-new-listings ratio, reflecting buyer’s market conditions with minimal activity. Condo sales totaled 18, yielding a 64.3% sales-to-new-listings ratio, suggesting seller’s market conditions for apartments. Furthermore, the combined sales-to-active-listings ratio for condos and townhouses achieved 13.9%, falling below Metro Vancouver’s condo baseline of 14.8% but aligning with the townhouse baseline of 13.6%. These ratios demonstrate buyer-favorable conditions for detached homes with elevated inventory levels, while the luxury condo segment shows more balanced demand dynamics.
Take a look at all the condos in West Vancouver with an open house coming up here.
Metro Vancouver Market Context – North Shore Shows Divergent Municipal Dynamics
November 2025 confirmed that Metro Vancouver housing market saw little change as year-end approached, with the North Shore reflecting this broader trend through divergent municipal dynamics. According to Greater Vancouver REALTORS®, Andrew Lis noted: “As the year draws to a close, the data continues telling a story of a market with many buyers patiently waiting and sellers adjusting to market conditions not seen in years.”
Furthermore, Lis observed that “inventory remains healthy, providing buyers ample choice, which, by contrast, is pushing sellers to accept that pricing must reflect this new reality.” Additionally, he commented: “As sales volumes remain subdued and inventory remains plentiful, properties are taking longer to sell, and pricing has continued to soften slightly across most market segments.”
Metro Vancouver’s sales-to-active-listings ratios stood at 9.7% for detached homes, 13.6% for townhouses, and 14.8% for condos. North Vancouver demonstrated strong performance compared to these benchmarks, with houses achieving 19.2% (nearly double Metro’s baseline), and combined townhouses and condos reaching 19.9% (significantly exceeding both Metro’s townhouse and condo baselines). This exceptional absorption indicates particularly robust demand relative to available inventory in North Vancouver.
Meanwhile, West Vancouver recorded subdued results with houses at 7.2% (below Metro’s baseline), and combined condos and townhouses at 13.9% (falling slightly below Metro’s condo average but aligning with townhouse levels). The divergent performance between North Vancouver’s strong absorption and West Vancouver’s softer demand highlights the varied dynamics within the North Shore market heading into year-end.
Therefore, the North Shore communities continue demonstrating distinct market characteristics as 2025 concludes. North Vancouver’s stronger absorption metrics suggest sustained buyer interest across all segments, while West Vancouver’s buyer-favorable conditions provide negotiating opportunities particularly in the ultra-luxury detached segment.
FAQ – North Shore Real Estate November 2025
Q: Are North Shore home prices rising or falling in November 2025?
A: North Shore prices showed mixed movements in November 2025. North Vancouver houses declined 0.2% monthly and 1.7% annually, townhouses fell 0.5% monthly and 4.6% annually, while condos increased 1.1% monthly but declined 0.7% annually. West Vancouver saw houses increase 1.0% monthly but decline 2.7% annually, while condos rose 4.3% monthly but fell 4.7% annually, reflecting stabilization with ongoing annual adjustment.
Q: Is it a good time to buy North Shore real estate in November 2025?
A: November 2025 presents distinct opportunities across both municipalities. North Vancouver shows strong market fundamentals with houses at 19.2% sales-to-active-listings (nearly double Metro’s 9.7%) and combined townhouses/condos at 19.9% (exceeding Metro benchmarks). West Vancouver demonstrates buyer-favorable conditions with houses at 7.2% (below Metro) offering negotiating opportunities in the luxury segment.
Q: Which North Shore area offers better real estate value in November 2025?
A: North Vancouver provides better value with houses at $2.1M versus West Vancouver’s $3.1M. Additionally, North Vancouver demonstrates exceptional market strength with detached home absorption nearly double Metro Vancouver averages (19.2% versus 9.7%), indicating sustained demand and price stability.
Q: How does North Vancouver compare to West Vancouver for real estate investment?
A: North Vancouver shows superior fundamentals with robust absorption across all segments—houses at 19.2% sales-to-active-listings (nearly double Metro’s 9.7%) and combined multi-family at 19.9% (exceeding Metro). West Vancouver offers luxury positioning with buyer-favorable detached conditions (7.2% ratio) providing negotiating opportunities for high-net-worth purchasers seeking premium waterfront locations.
Q: What are the best North Shore communities to buy in November 2025?
A: Both North Shore municipalities offer distinct advantages. North Vancouver provides strong value with below-West-Vancouver pricing and exceptional demand fundamentals across all property types. West Vancouver delivers ultra-luxury positioning with prestigious addresses and buyer-favorable conditions in the detached segment, ideal for purchasers seeking premium waterfront properties with negotiating leverage.
Featured Buildings


