Vancouver Real Estate November 2025 | Vancouver East & Vancouver West Market
Written by Colin Gatward
In November 2025, Vancouver real estate continued the subdued market trends observed throughout the fall season. Subsequently, healthy inventory levels provided buyers with ample choice across all property types. Moreover, both Vancouver East and Vancouver West showed price softening as sellers adjusted expectations. As a result, transaction volumes remained below year-ago levels while market conditions favored patient buyers.
Vancouver East Real Estate November 2025 – Buyer-Favorable Conditions Across Segments
Vancouver East real estate market demonstrated buyer-favorable conditions throughout November 2025. Therefore, this created opportunities for purchasers across most property segments.
Vancouver East Housing Market Price Analysis:
Vancouver East Detached Homes / Houses:
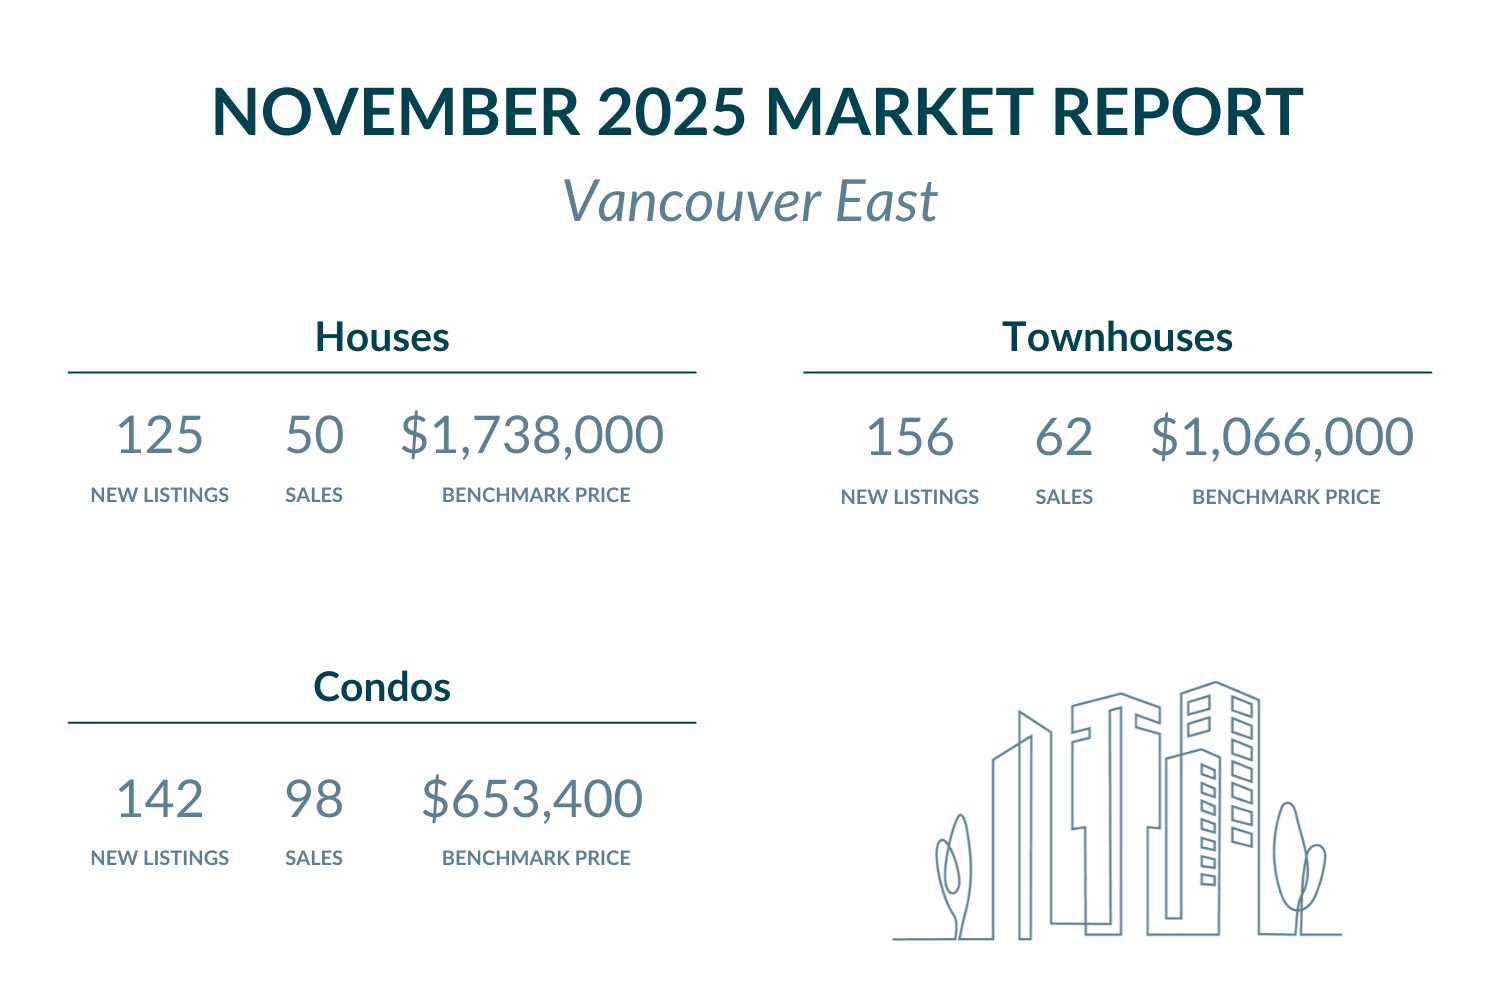
The benchmark price declined 1.0% month-over-month to $1,738,000. Furthermore, this represents a 6.9% decrease compared to November 2024. Currently, Vancouver East remains below Metro Vancouver’s benchmark of $1,900,600. Specifically, this provides approximately $162,600 value advantage from regional averages.
Browse Vancouver East detached homes under $1,740,000 here, or explore available options above $1,740,000.
Vancouver East Townhouses / Attached Homes:
Townhouse prices increased 1.4% from October to $1,066,000. However, year-over-year prices dropped 3.7% from November 2024. Currently, Vancouver East essentially matches Metro Vancouver’s benchmark of $1,065,600.
Explore Vancouver East townhomes listed below $1,070,000 here, or check out exclusive properties above $1,070,000.
Vancouver East Condos / Apartments:
Condo prices declined 1.1% from October to $653,400. Additionally, prices decreased 5.7% compared to November 2024. Currently, Vancouver East stays below Metro Vancouver’s benchmark of $714,300. Moreover, this provides approximately $60,900 value advantage over regional averages.
Search Vancouver East condos priced below $655,000 here, or view high-end listings above $655,000.
Vancouver East Real Estate Market Activity:
New listings showed varied results across different property types. Vancouver East detached home listings totaled 125 in November, down from October’s 183. Meanwhile, this represented a 0.8% year-over-year decrease. Active inventory stood at 568 detached homes. Townhouse listings in Vancouver East reached 156, down from October’s 187. Nevertheless, this marked a solid 7.7% increase year-over-year. Vancouver East condo listings totaled 142, down sharply from October’s 228, showing a significant 44.4% year-over-year decline. Active inventory for townhouses and condos combined stood at 596 units.
Sales activity showed weakening performance across all property segments. Detached home sales totaled 50 with a 40.0% sales-to-new-listings ratio, indicating balanced market conditions. Additionally, the sales-to-active-listings ratio reached 8.8%, slightly below Metro Vancouver’s 9.7% baseline. Townhouse sales reached 62, producing a 39.7% sales-to-new-listings ratio, reflecting balanced conditions with slight buyer advantage. Condo sales totaled 98, yielding a 69.0% sales-to-new-listings ratio, suggesting seller’s market conditions for apartments. Furthermore, the combined sales-to-active-listings ratio for townhouses and condos achieved 19.6%, exceeding Metro Vancouver’s townhouse baseline of 13.6% and condo baseline of 14.8%. These ratios indicate healthy demand for multi-family properties despite softening detached home activity in Vancouver East.
Take a look at all the condos in Vancouver East with an open house coming up here.

Vancouver West Real Estate November 2025 – Premium Market Shows Mixed Dynamics
Vancouver West real estate market maintained premium positioning while demonstrating mixed market dynamics throughout November 2025. Consequently, this created distinct opportunities across different property segments.
Vancouver West Housing Market Price Analysis:
Vancouver West Detached Homes / Houses:
The benchmark price declined 0.4% month-over-month to $3,172,700. However, year-over-year prices decreased 4.5% from November 2024. Currently, Vancouver West significantly exceeds Metro Vancouver’s benchmark of $1,900,600. Moreover, this commands a substantial premium of approximately $1,272,100.
Browse Vancouver West detached homes listed under $3,175,000 here, or explore upscale options above $3,175,000.
Vancouver West Townhouses / Attached Homes:
Townhouse prices increased 0.3% from October to $1,366,600. However, year-over-year prices dropped 9.9% from November 2024. Specifically, Vancouver West substantially exceeds Metro Vancouver’s benchmark of $1,065,600. As a result, this commands approximately $301,000 premium above regional standards.
Check out Vancouver West townhouses available under $1,370,000 here, or explore luxury properties exceeding $1,370,000.
Vancouver West Condos / Apartments:
Condo prices decreased 0.6% from October to $776,600. Additionally, year-over-year prices fell 6.2% from November 2024. Currently, Vancouver West remains above Metro Vancouver’s benchmark of $714,300. Therefore, this represents approximately $62,300 premium over regional averages.
View Vancouver West condos listed below $780,000 here, or check out high-end selections above $780,000.
Vancouver West Real Estate Market Activity:
New listings displayed varied trends across property segments. Vancouver West detached home new listings decreased to 119 from October’s 212. Meanwhile, this marked a 5.0% year-over-year decline. Active inventory stood at 704 detached homes. Townhouse new listings in Vancouver West reached 124, down from October’s 177. Nevertheless, this reflected a solid 12.1% increase year-over-year. Vancouver West condo new listings totaled 549, down from October’s 663, representing a 14.2% increase year-over-year. Active inventory for condos and townhouses combined stood at 959 units, while Downtown Vancouver condos and townhouses totaled 1,049 units.
Sales activity showed varied market dynamics across all property types. Detached home sales totaled 59 with a 49.6% sales-to-new-listings ratio, indicating balanced market conditions. Additionally, the sales-to-active-listings ratio reached 8.1%, below Metro Vancouver’s 9.7% baseline. Townhouse sales reached 43, producing a 34.7% sales-to-new-listings ratio, reflecting buyer’s market conditions with increased negotiating power for purchasers. Condo sales led with 260 transactions, yielding a 47.4% sales-to-new-listings ratio, suggesting balanced market conditions. Furthermore, the combined sales-to-active-listings ratio for condos and townhouses achieved 15.1%, exceeding Metro Vancouver’s townhouse baseline of 13.6% but aligning with the condo baseline of 14.8%. The Downtown Vancouver combined ratio stood at 13.3%, slightly below the broader market. These ratios demonstrate buyer-favorable conditions for detached homes and townhouses while condos show more balanced positioning.
Take a look at all the detached homes in Vancouver West with an open house coming up here.
Metro Vancouver Market Context – Market Sees Little Change as Year-End Nears
November 2025 confirmed that Metro Vancouver housing market trends observed in October continued with little change as the year draws to a close. According to Greater Vancouver REALTORS®, Andrew Lis noted: “As the year draws to a close, the data continues telling a story of a market with many buyers patiently waiting and sellers adjusting to market conditions not seen in years.” Furthermore, Lis observed that “inventory remains healthy, providing buyers ample choice, which, by contrast, is pushing sellers to accept that pricing must reflect this new reality.”
Additionally, Lis commented: “As sales volumes remain subdued and inventory remains plentiful, properties are taking longer to sell, and pricing has continued to soften slightly across most market segments.” He added: “With borrowing costs likely to remain steady into the new year, any uptick in demand will need to arise from a significant change in buyer sentiment.”
Metro Vancouver’s sales-to-active-listings ratios stood at 9.7% for detached homes, 13.6% for townhouses, and 14.8% for condos. Vancouver East showed varied performance compared to these benchmarks, with houses achieving 8.8% (slightly below Metro), while the combined townhouse and condo ratio reached 19.6% (exceeding both Metro’s townhouse and condo baselines). Meanwhile, Vancouver West recorded below-market results with houses at 8.1% (below Metro), and combined condos and townhouses at 15.1% (aligning with Metro levels). The Downtown Vancouver combined ratio of 13.3% fell below Metro averages. These comparisons indicate continued buyer-favorable conditions heading into year-end, with healthy inventory providing ample choice for purchasers across Vancouver communities.
Therefore, both Vancouver communities continue demonstrating buyer-favorable market dynamics as 2025 concludes. The subdued sales activity and plentiful inventory suggest market conditions should remain favorable for purchasers into early 2026, particularly for detached homes and townhouses where inventory levels remain elevated.
FAQ – Vancouver Real Estate November 2025
Q: Are Vancouver home prices rising or falling in November 2025?
A: Vancouver prices continued softening in November 2025. Vancouver East houses declined 1.0% monthly and 6.9% annually, while townhouses increased 1.4% monthly but fell 3.7% annually, and condos dropped 1.1% monthly and 5.7% annually. Vancouver West saw houses decline 0.4% monthly and 4.5% annually, townhouses increase 0.3% monthly but fall 9.9% annually, and condos decrease 0.6% monthly and 6.2% annually, reflecting ongoing price adjustment.
Q: Is it a good time to buy Vancouver real estate in November 2025?
A: November 2025 presents favorable buying conditions with buyer-advantaged market dynamics. Vancouver East shows sales-to-active-listings ratios of 8.8% for houses and 19.6% combined for townhouses and condos. Vancouver West demonstrates 8.1% for houses and 15.1% combined for condos and townhouses. Healthy inventory provides buyers with ample choice and negotiating leverage across most segments.
Q: Which Vancouver area offers better real estate value in November 2025?
A: Vancouver East provides superior value with houses at $1.7M versus Vancouver West’s $3.2M. Additionally, Vancouver East prices stay below Metro Vancouver benchmarks for houses while showing strong multi-family absorption (19.6% sales-to-active-listings ratio for townhouses and condos combined).
Q: How does Vancouver East compare to Vancouver West for real estate investment?
A: Vancouver East shows better value positioning with below-market pricing and stronger multi-family demand fundamentals (19.6% combined sales-to-active-listings ratio versus Metro’s 13.6% for townhouses and 14.8% for condos). Vancouver West offers luxury positioning with premium amenities but demonstrates buyer’s market conditions for townhouses (34.7% sales-to-new-listings ratio) providing negotiating opportunities.
Q: What are the best Vancouver communities to buy in November 2025?
A: Both Vancouver East and Vancouver West offer distinct advantages in buyer-favorable conditions. Vancouver East provides exceptional value with below-market pricing and healthy multi-family demand, while Vancouver West delivers luxury market opportunities with premium locations. Buyers benefit from increased inventory and negotiating power across both communities heading into year-end.
Other Presales, Condos, Townhomes Updates
Featured Buildings


