
Vancouver real estate October 2025 confirmed the continuation of buyer-favorable market conditions throughout the fall season. Subsequently, slower sales activity combined with elevated inventory created negotiating opportunities across property types. Moreover, both Vancouver East and Vancouver West experienced varied performance across segments. As a result, the market demonstrated distinct dynamics between detached homes and higher-density properties.

Vancouver East Real Estate October 2025 – Mixed Performance with Strong Detached Recovery
Vancouver East real estate market displayed contrasting trends throughout October 2025. Therefore, this created diverse opportunities depending on property type and buyer objectives.
Vancouver East Housing Market Price Analysis:
Vancouver East Detached Homes / Houses:
The benchmark price for detached homes declined modestly by 0.4% month-over-month to $1,749,100. Furthermore, this represents a 7.5% decrease compared to October 2024. Nevertheless, Vancouver East remains below Metro Vancouver’s benchmark of $1,916,400. Specifically, this provides approximately $167,300 discount from regional averages.
Browse Vancouver East detached homes under $1,750,000 here, or explore available options above $1,750,000.
Vancouver East Townhouses / Attached Homes:
Townhouse prices increased 0.5% from September to $1,053,900. However, year-over-year prices dropped 8.9% from October 2024. Currently, Vancouver East stays just below Metro Vancouver’s benchmark of $1,066,700. As a result, this represents approximately $12,800 marginal discount from regional standards.
Explore Vancouver East townhomes listed below $1,055,000 here, or check out exclusive properties above $1,055,000.
Vancouver East Condos / Apartments:
Condo prices declined 3.2% from September to $651,500. Additionally, prices decreased 5.0% compared to October 2024. Currently, Vancouver East stays below Metro Vancouver’s benchmark of $718,900. Moreover, this provides approximately $67,400 value advantage over regional averages.
Search Vancouver East condos priced below $655,000 here, or view high-end listings above $655,000.
Vancouver East Real Estate Market Activity:
New listings showed mixed results across different property types. Detached home listings reached 183 in October, down from September’s 211. Meanwhile, this represented a modest 1.6% year-over-year increase. Currently, active inventory stands at 605 detached homes. Townhouse listings totaled 187, down from September’s 250. Nevertheless, this marked a solid 5.9% increase year-over-year. Condo listings reached 228, down from September’s 343, showing a 9.6% year-over-year decline. Active inventory totals 683 townhomes and condos combined.
Sales activity showed notably divergent performance across property segments. Detached home sales totaled 91 with a 49.7% sales-to-new-listings ratio, indicating balanced market conditions approaching seller advantage. Additionally, the sales-to-active-listings ratio reached 14.9%, exceeding Metro Vancouver’s baseline of 11.3%. Townhouse sales reached 69, producing a 36.9% sales-to-new-listings ratio, reflecting buyer’s market conditions with increased negotiating power. Condo sales totaled 108, yielding a 47.4% sales-to-new-listings ratio, suggesting balanced market conditions. Furthermore, the combined sales-to-active-listings ratio for townhomes and condos achieved 20.8%, notably exceeding Metro Vancouver’s averages of 17.6% for townhouses and 15.5% for condos. These ratios indicate varied demand dynamics, with detached homes showing resilient buyer interest despite broader market softness.
Upcoming Open Houses:
- Take a look at all the Houses in Vancouver East with an open house coming up here.
- Explore all the Townhomes in Vancouver East with an open house coming up here.
- View all the Condos in Vancouver East with an open house coming up here.
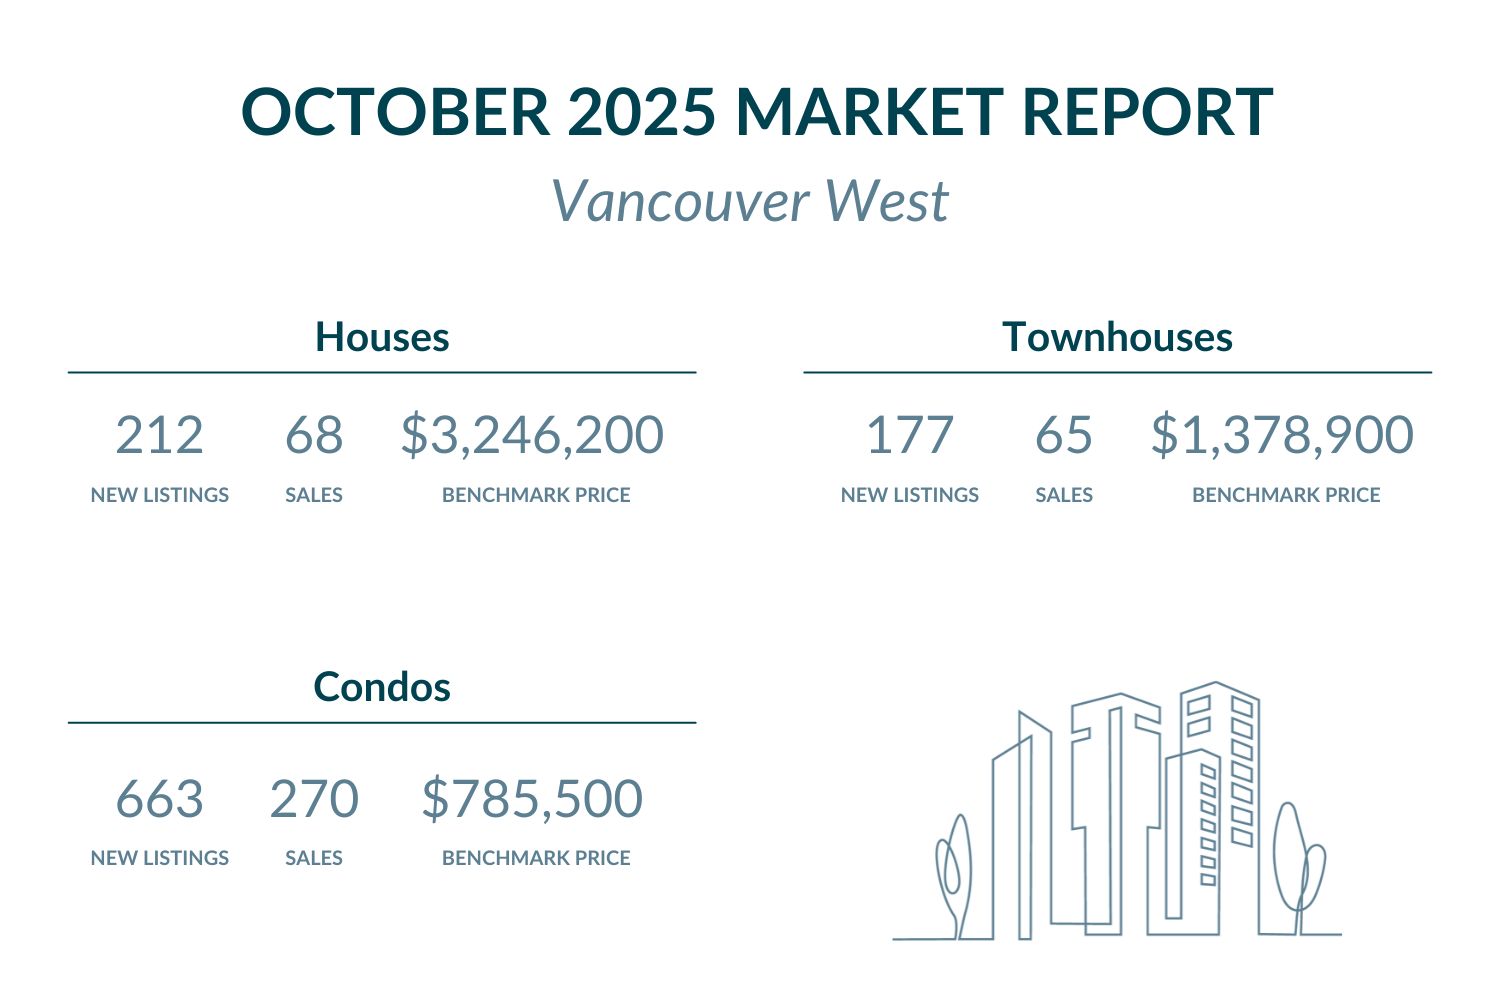
Vancouver West Real Estate October 2025 – Premium Market Experiences Continued Softening
Vancouver West real estate market maintained premium positioning while demonstrating uneven activity throughout October 2025. Consequently, this reflected buyer caution in the luxury segment alongside selective opportunities.
Vancouver West Housing Market Price Analysis:
Vancouver West Detached Homes / Houses:
The benchmark price increased 0.4% month-over-month to $3,246,200. However, year-over-year prices decreased 3.6% from October 2024. Currently, Vancouver West significantly exceeds Metro Vancouver’s benchmark of $1,916,400. Moreover, this commands a substantial premium of approximately $1,329,800.
Browse Vancouver West detached homes listed under $3,250,000 here, or explore upscale options above $3,250,000.
Vancouver West Townhouses / Attached Homes:
Townhouse prices increased 0.4% from September to $1,378,900. Similarly, year-over-year prices dropped 5.3% from October 2024. Specifically, Vancouver West substantially exceeds Metro Vancouver’s benchmark of $1,066,700. As a result, this commands approximately $312,200 premium above regional standards.
Check out Vancouver West townhouses available under $1,380,000 here, or explore luxury properties exceeding $1,380,000.
Vancouver West Condos / Apartments:
Condo prices decreased 2.3% from September to $785,500. Additionally, year-over-year prices fell 5.4% from October 2024. Currently, Vancouver West remains above Metro Vancouver’s benchmark of $718,900. Therefore, this represents approximately $66,600 premium over regional averages.
View Vancouver West condos listed below $790,000 here, or check out high-end selections above $790,000.
Vancouver West Real Estate Market Activity:
New listings displayed contrasting trends across property segments. Detached home new listings reached 212 from September’s 245. Meanwhile, this marked a substantial 19.8% increase year-over-year. Currently, active inventory stands at 742 detached homes. Townhouse new listings totaled 177, down from September’s 218. Nevertheless, this reflected a modest 3.4% increase year-over-year. Condo new listings reached 663, down from September’s 827, representing a significant 19.2% decline year-over-year. Active inventory totals 1,004 for condos and townhomes in Vancouver West (excluding downtown), while Vancouver Downtown maintains 1,114 active condo and townhome listings.
Sales activity showed pronounced buyer’s market conditions across multiple property types. Detached home sales totaled 68 with a 32.1% sales-to-new-listings ratio, indicating buyer’s market conditions with substantial negotiating leverage for purchasers. Additionally, the sales-to-active-listings ratio reached 9.2%, below Metro Vancouver’s baseline of 11.3%. Townhouse sales reached 65, producing a 36.7% sales-to-new-listings ratio, reflecting buyer’s market conditions. Condo sales led with 270 transactions, yielding a 40.7% sales-to-new-listings ratio, suggesting balanced market conditions with slight buyer advantage. Furthermore, the combined sales-to-active-listings ratio for townhomes and condos in Vancouver West (excluding downtown) achieved 18.1%, exceeding Metro Vancouver’s averages of 17.6% for townhouses and 15.5% for condos. Meanwhile, Vancouver Downtown recorded a combined sales-to-active-listings ratio of 12.7%, reflecting softer demand in the downtown core. These ratios demonstrate buyer-favorable dynamics across Vancouver West’s luxury market segments, with notably different absorption rates between downtown and the broader westside neighborhoods.
Upcoming Open Houses:
- Take a look at all the Houses in Vancouver West with an open house coming up here.
- Explore all the Townhomes in Vancouver West with an open house coming up here.
- View all the Condos in Vancouver West with an open house coming up here.
Metro Vancouver Market Context – Buyer Conditions Strengthen Across Region
October 2025 confirmed that slower sales and elevated inventory created increasingly favorable conditions for Metro Vancouver homebuyers. According to Greater Vancouver REALTORS®, Andrew Lis noted: “October is typically the last month of the year where sales activity sees a seasonal uptick, but sales still fell short of last year’s figures and the ten-year seasonal average.”
Furthermore, Lis observed that “even the fourth cut this year to the Bank of Canada’s policy rate this October wasn’t enough to entice more buyers back into the market.” Additionally, he noted: “After peaking in June, inventory levels have edged lower, and prices have eased across all market segments as slower-than-usual sales activity meets the highest inventory levels seen in many years.”
Metro Vancouver’s sales-to-active-listings ratios stood at 11.3% for detached homes, 17.6% for townhouses, and 15.5% for condos. Vancouver East demonstrated strong performance with detached homes achieving 14.9% (exceeding Metro’s 11.3%), while the combined sales-to-active-listings ratio for townhomes and condos reached 20.8%, notably surpassing both Metro Vancouver’s townhouse ratio of 17.6% and condo ratio of 15.5%. This indicates robust absorption across higher-density properties in Vancouver East.
Meanwhile, Vancouver West displayed more nuanced dynamics across its submarkets. Detached homes recorded a 9.2% sales-to-active-listings ratio (below Metro’s 11.3%), reflecting buyer-favorable conditions in the premium segment. However, the westside neighborhoods (excluding downtown) showed stronger performance with a combined townhome and condo sales-to-active-listings ratio of 18.1%, exceeding Metro Vancouver’s separate benchmarks of 17.6% for townhouses and 15.5% for condos. In contrast, Vancouver Downtown recorded a combined sales-to-active-listings ratio of 12.7% for townhomes and condos, falling below Metro averages and indicating notably softer demand in the downtown core compared to the broader westside neighborhoods.
Therefore, both Vancouver communities continue demonstrating buyer-advantaged market conditions with varied dynamics by property type. The overall trend indicates sustained negotiating opportunities as the market transitions into the traditionally quieter winter months, particularly benefiting purchasers in Vancouver West’s luxury segments.
FAQ – Vancouver Real Estate October 2025
Q: Are Vancouver home prices rising or falling in October 2025?
A: Vancouver prices showed mixed movement in October 2025. Vancouver East detached homes declined 0.4% monthly while townhouses gained 0.5% and condos dropped 3.2%. Vancouver West detached homes and townhouses both rose 0.4% while condos declined 2.3%.
Q: Is it a good time to buy Vancouver real estate in October 2025?
A: October 2025 presents increasingly favorable buying conditions with buyer-advantaged market dynamics. Vancouver East shows sales-to-active-listings ratios of 14.9% to 20.8%, while Vancouver West demonstrates 9.2% to 15.3% ratios. Market conditions favor purchasers across most segments, particularly in Vancouver West’s luxury detached market.
Q: Which Vancouver area offers better real estate value in October 2025?
A: Vancouver East provides superior value with detached homes at $1.7M versus Vancouver West’s $3.2M. Additionally, Vancouver East prices stay below Metro Vancouver benchmarks across all property types, while Vancouver West maintains premium positioning with substantial price advantages for value-focused buyers.
Q: How does Vancouver East compare to Vancouver West for real estate investment?
A: Vancouver East shows stronger relative demand with detached homes exceeding Metro Vancouver’s sales-to-active-listings ratio (14.9% vs 11.3%), indicating better absorption despite lower prices. Vancouver West offers luxury market opportunities with buyer-favorable conditions (9.2% detached ratio) providing negotiating leverage for premium purchasers.
Q: What are the best Vancouver communities to buy in October 2025?
A: Both Vancouver East and Vancouver West offer distinct advantages in October 2025. Vancouver East provides value-oriented opportunities with below-market pricing and relatively stronger demand fundamentals, while Vancouver West delivers luxury market access with increased buyer negotiating power and premium locations.
Other Presales, Condos, Townhomes Updates
Featured Buildings


