As the summer progresses, the North Shore real estate market, including North Vancouver and West Vancouver, continues to show nuanced shifts in prices, listings, and sales activities.
North Vancouver – Double than Average Sales Ratios with Modest Price Increases
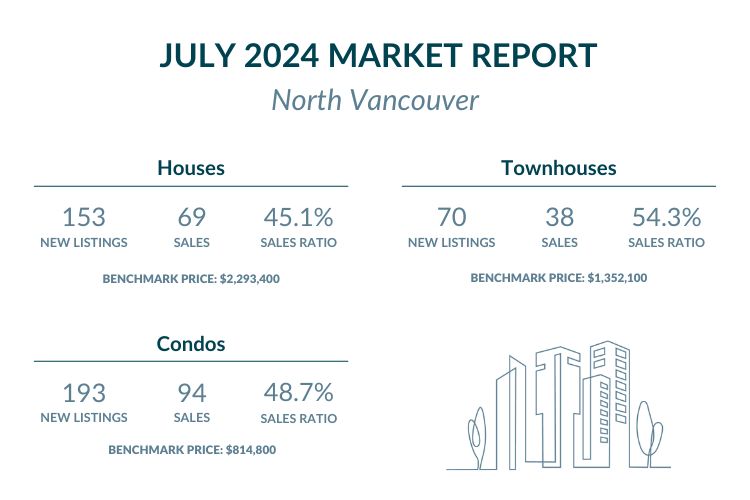
Metro Vancouver’s average sales ratio remains below 20%, but North Vancouver continues to thrive with sales ratios well over 45%, surpassing 50% for townhomes, and showing a modest benchmark price increase compared to previous periods.
Price Analysis:
House/Detached:
The benchmark price for houses in North Vancouver in July 2024 was $2,293,400. This reflects a slight decrease of 0.5% from June 2024 but a 1.9% increase year-over-year compared to July 2023.
Check out North Vancouver houses under $2,293,400 here, or find those priced over $2,293,400 here.
Townhouse/Attached:
Townhouse prices dropped by 2.7% from June 2024 to $1,352,100 in July 2024. On an annual basis, prices remained relatively stable with a 0.2% increase from July 2023.
Explore North Vancouver townhomes under $1,352,100 here, discover townhouses priced over $1,352,100 here.
Condo/Apartments:
The benchmark price for condos in North Vancouver was $814,800 in July 2024, down by 1.2% from the previous month but up by 1.0% year-over-year.
Browse North Vancouver condos under $814,800 here and view apartments over $814,800 here.
New Listings and Sales:
In July 2024, North Vancouver saw new house listings drop to 153, down from 162 in June, yet still marking a strong 30.7% increase compared to July 2023 (106 new listings). Similarly, new townhouse listings in North Vancouver fell to 70 from 87 in June, though this still reflected a 27.1% year-over-year rise (51 new listings). Condo new listings in North Van followed the same pattern, decreasing slightly to 193 in July from 205 in June, but showing a notable 24.4% increase compared to July 2023.
Despite the influx of new listings, house sales in North Vancouver remained nearly stable, with 69 units sold in July 2024, just one less than in June. However, the sales ratio for July dropped by 17.6% year-over-year to 45.1%. Townhouse sales also declined, with 38 units sold in July, down from 45 in June, though the sales ratio saw only a minimal year-over-year decrease of 1.1%, standing at 54.3%. Condo sales fell to 94 in July from 103 in June, with the sales ratio at 48.7%, marking a significant 28.2% decline compared to July 2023. This trend of rising new listings alongside declining sales ratios suggests a potential cooling in buyer demand across North Vancouver.
West Vancouver – Still Higher than Average Sales Ratios with Modest Price Increases
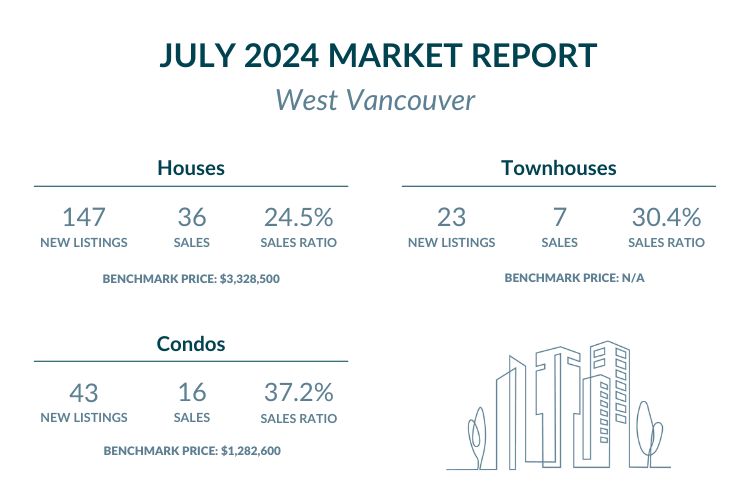
With Metro Vancouver’s average sales ratio below 20%, West Vancouver continues to thrive with sales ratios nearing 25% and surpassing 35% for condos, accompanied by a significant benchmark price increase compared to July 2023.
Price Analysis:
House/Detached:
In West Vancouver, the benchmark price for houses in July 2024 was $3,328,500, a slight decrease of 0.2% from June 2024 but a 3.1% increase year-over-year from July 2023.
Explore into West Vancouver houses under $3,328,500 here, or view single homes priced above $3,328,500 here.
Condo/Apartments:
The benchmark price for condos dropped significantly by 5.0% from June 2024 to $1,282,600 in July 2024, and by 5.4% compared to July 2023.
See West Vancouver condos under $1,282,600 here, and uncover prices over $1,350,900 here.
New Listings and Sales:
In July 2024, West Vancouver saw new house listings rise to 147, up from 142 in June, marking a 10.9% increase compared to July 2023 (131 new listings). Similarly, new townhouse listings in West Vancouver climbed to 23, up from 18 in June, reflecting a 26.1% year-over-year increase (17 new listings in July 2023). West Vancouver’s condo new listings, however, declined to 43 in July from 53 in June, but still showed a 23.3% increase compared to July 2023 (33 new listings).
Despite the increase in new listings, house sales in West Vancouver dropped to 36 in July 2024 from 43 in June. However, the sales ratio for July saw a significant 39.5% increase year-over-year, reaching 24.5%. Townhouse sales experienced a slight increase to 7 in July from 6 in June, with the sales ratio jumping by 158.7% year-over-year to 30.4%. In contrast, condo sales fell to 16 in July from 25 in June, with the sales ratio declining sharply by 46.6% compared to July 2023, settling at 37.2%. This mixed performance across property types suggests varying levels of buyer interest in West Vancouver’s market.
Conclusion
The North Shore real estate market in July 2024 reveals a complex mix of rising new listings and fluctuating sales ratios, with varying impacts on pricing across different property types. North Vancouver continues to see slight declines in month-over-month prices but maintains moderate annual gains, particularly in the housing segment. In West Vancouver, the market shows more significant volatility, particularly in the condo sector, where prices and sales have decreased notably.
Although sales ratios have decreased compared to July 2023, activity levels remain significantly higher than the Metro Vancouver average. The average sales ratios for detached houses, townhomes, and condos were 12.8%, 20.1%, and 19.3%, respectively.
As the market continues to adjust, both buyers and sellers should stay informed and consider these trends when making decisions. Strategic pricing and timing remain key in navigating the evolving North Shore real estate landscape.
Featured Buildings


